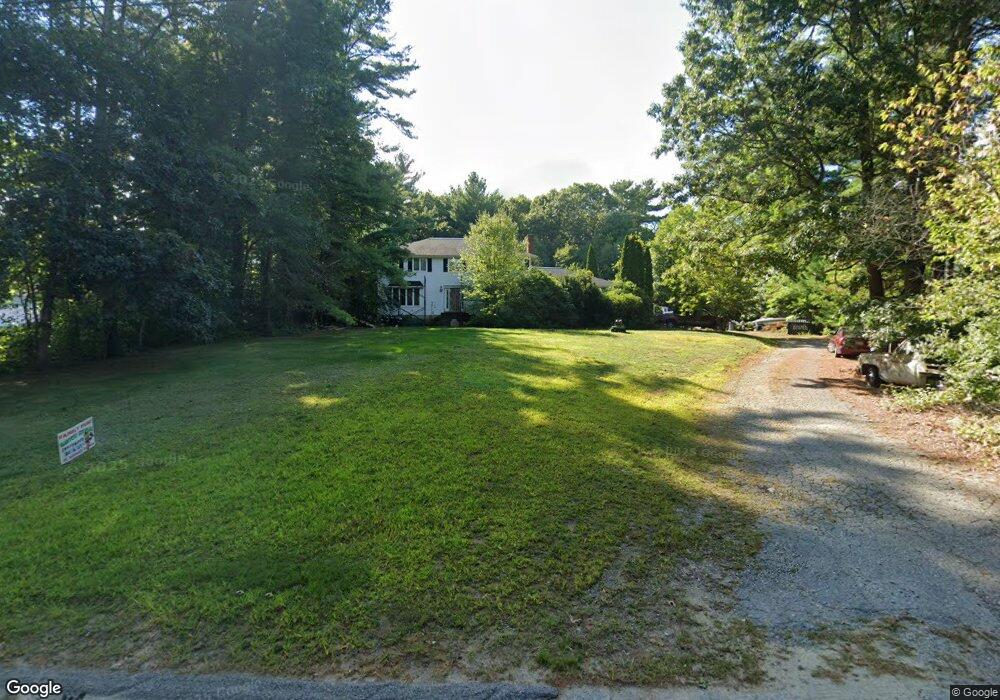
24 Dunham Rd Assonet, MA 02702
Estimated Value: $661,000 - $877,000
4
Beds
3
Baths
2,584
Sq Ft
$293/Sq Ft
Est. Value
About This Home
This home is located at 24 Dunham Rd, Assonet, MA 02702 and is currently estimated at $757,180, approximately $293 per square foot. 24 Dunham Rd is a home located in Bristol County with nearby schools including Freetown Elementary School, George R Austin Intermediate School, and Freetown-Lakeville Middle School.
Ownership History
Date
Name
Owned For
Owner Type
Purchase Details
Closed on
Nov 13, 1997
Sold by
Emc Mtg Corp
Bought by
Grace William D and Grace Carolyn A
Current Estimated Value
Home Financials for this Owner
Home Financials are based on the most recent Mortgage that was taken out on this home.
Original Mortgage
$160,950
Interest Rate
7.23%
Mortgage Type
Purchase Money Mortgage
Purchase Details
Closed on
Feb 3, 1997
Sold by
Emc Mtg Corp and Levesque Albert C
Bought by
Emc Mtg Corp
Create a Home Valuation Report for This Property
The Home Valuation Report is an in-depth analysis detailing your home's value as well as a comparison with similar homes in the area
Purchase History
| Date | Buyer | Sale Price | Title Company |
|---|---|---|---|
| Grace William D | $152,500 | -- | |
| Emc Mtg Corp | $140,037 | -- |
Source: Public Records
Mortgage History
| Date | Status | Borrower | Loan Amount |
|---|---|---|---|
| Open | Emc Mtg Corp | $157,966 | |
| Closed | Emc Mtg Corp | $160,950 | |
| Previous Owner | Emc Mtg Corp | $8,000 |
Source: Public Records
Tax History
| Year | Tax Paid | Tax Assessment Tax Assessment Total Assessment is a certain percentage of the fair market value that is determined by local assessors to be the total taxable value of land and additions on the property. | Land | Improvement |
|---|---|---|---|---|
| 2025 | $6,457 | $651,600 | $193,300 | $458,300 |
| 2024 | $6,472 | $620,500 | $182,400 | $438,100 |
| 2023 | $6,317 | $589,800 | $164,200 | $425,600 |
| 2022 | $6,019 | $499,100 | $139,100 | $360,000 |
| 2021 | $5,341 | $454,400 | $126,500 | $327,900 |
| 2020 | $5,797 | $445,200 | $121,700 | $323,500 |
| 2019 | $5,208 | $421,000 | $121,400 | $299,600 |
| 2018 | $5,186 | $389,600 | $121,400 | $268,200 |
| 2017 | $5,064 | $380,200 | $121,400 | $258,800 |
| 2016 | $4,600 | $351,400 | $117,900 | $233,500 |
| 2015 | $4,404 | $341,400 | $112,500 | $228,900 |
| 2014 | $4,286 | $339,900 | $115,500 | $224,400 |
Source: Public Records
Map
Nearby Homes
- 0 Sammys Ln
- 52 Anthony St
- 37 Simpson Ln
- 71 County St
- 5 Hadley Heights Way
- 16 Water St Unit C
- 16 Water St Unit A
- 16 Water St Unit B
- 16 Water St Unit D
- 23 Elmwood Dr
- 4 Hadley Heights Way
- 24 Bells Brook Rd
- 145 County St
- 42 High St
- 73 Seymour St
- 14 Marks Ln
- 117 High St
- 144 Chace Rd
- 4 Narrows Rd
- 47 Narrows Rd
Your Personal Tour Guide
Ask me questions while you tour the home.