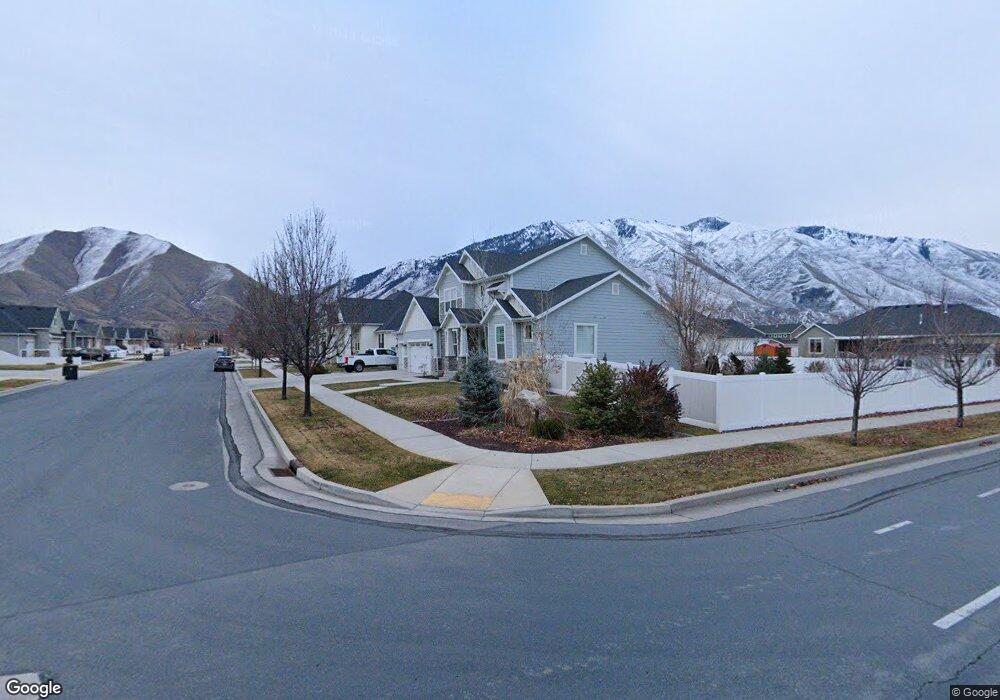
24 E 700 N Mapleton, UT 84664
Estimated Value: $890,000 - $1,148,000
6
Beds
4
Baths
3,971
Sq Ft
$246/Sq Ft
Est. Value
About This Home
This home is located at 24 E 700 N, Mapleton, UT 84664 and is currently estimated at $978,027, approximately $246 per square foot. 24 E 700 N is a home located in Utah County with nearby schools including Hobble Creek School, Mapleton Junior High School, and Maple Mountain High School.
Ownership History
Date
Name
Owned For
Owner Type
Purchase Details
Closed on
Oct 5, 2018
Sold by
Harward Lenny and Harward Valerie
Bought by
Collins Rory D and Collins Jodi
Current Estimated Value
Home Financials for this Owner
Home Financials are based on the most recent Mortgage that was taken out on this home.
Original Mortgage
$453,100
Outstanding Balance
$395,130
Interest Rate
4.5%
Mortgage Type
New Conventional
Estimated Equity
$582,897
Purchase Details
Closed on
Apr 28, 2017
Sold by
Arive Homes Llc
Bought by
Harward Lenny and Harward Valerie
Purchase Details
Closed on
Jul 8, 2015
Sold by
91275 Llc
Bought by
Arive Homes Llc
Home Financials for this Owner
Home Financials are based on the most recent Mortgage that was taken out on this home.
Original Mortgage
$700,000
Interest Rate
3.83%
Mortgage Type
Commercial
Create a Home Valuation Report for This Property
The Home Valuation Report is an in-depth analysis detailing your home's value as well as a comparison with similar homes in the area
Home Values in the Area
Average Home Value in this Area
Purchase History
| Date | Buyer | Sale Price | Title Company |
|---|---|---|---|
| Collins Rory D | -- | Vanguard Title Ins Agencyllc | |
| Harward Lenny | -- | Provo Land Title Co | |
| Arive Homes Llc | -- | Provo Land Title Co |
Source: Public Records
Mortgage History
| Date | Status | Borrower | Loan Amount |
|---|---|---|---|
| Open | Collins Rory D | $453,100 | |
| Previous Owner | Arive Homes Llc | $700,000 |
Source: Public Records
Tax History
| Year | Tax Paid | Tax Assessment Tax Assessment Total Assessment is a certain percentage of the fair market value that is determined by local assessors to be the total taxable value of land and additions on the property. | Land | Improvement |
|---|---|---|---|---|
| 2025 | $4,150 | $456,280 | -- | -- |
| 2024 | $4,150 | $406,560 | $0 | $0 |
| 2023 | $4,347 | $428,560 | $0 | $0 |
| 2022 | $4,954 | $482,845 | $0 | $0 |
| 2021 | $4,167 | $623,600 | $192,200 | $431,400 |
| 2020 | $4,040 | $584,900 | $170,100 | $414,800 |
| 2019 | $3,494 | $516,300 | $150,800 | $365,500 |
| 2018 | $3,182 | $447,600 | $143,000 | $304,600 |
| 2017 | $2,623 | $195,800 | $0 | $0 |
| 2016 | $2,519 | $186,890 | $0 | $0 |
Source: Public Records
Map
Nearby Homes
- 24 E 700 N Unit 13
- 700 N Main St Unit 15
- 700 N Main St
- 700 N Main St Unit 13
- 42 E 700 N
- 42 E 700 N Unit 14
- 27 E 600 N Unit 24
- 45 E 600 N Unit 23
- 724 N Main St
- 841 N Main St Unit 4
- 150 N Main St
- 410 N Main St
- 135 N Main St
- 37 E 700 N
- 37 E 700 N Unit 11
- 86 E 700 N Unit 14
- 86 E 700 N Unit 15
- 36 W 600 N
- 675 N Main St
- 715 N Main St
Your Personal Tour Guide
Ask me questions while you tour the home.