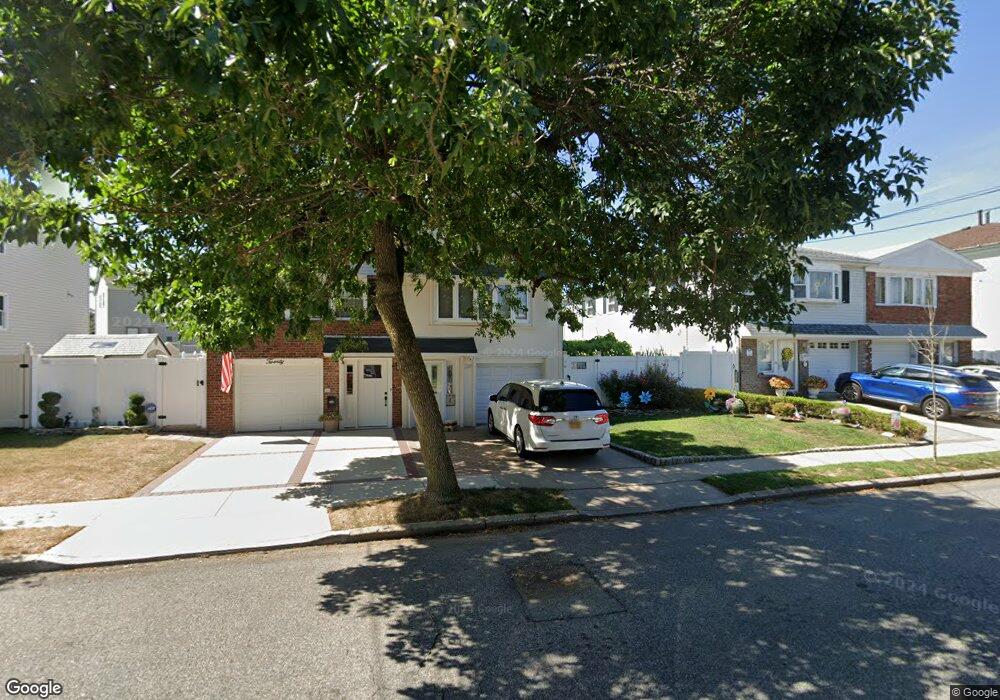
24 E Broadway Staten Island, NY 10306
Oakwood NeighborhoodEstimated Value: $774,000 - $879,000
--
Bed
4
Baths
2,200
Sq Ft
$379/Sq Ft
Est. Value
About This Home
This home is located at 24 E Broadway, Staten Island, NY 10306 and is currently estimated at $832,830, approximately $378 per square foot. 24 E Broadway is a home located in Richmond County with nearby schools including P.S. 23 Richmondtown, Myra S. Barnes Intermediate School 24, and New Dorp High School.
Ownership History
Date
Name
Owned For
Owner Type
Purchase Details
Closed on
Nov 9, 2016
Sold by
Sanfelippo Paul and Sanfelippo Kenneth
Bought by
Tung Tsui Kwan and Sanfelippo Kenneth
Current Estimated Value
Home Financials for this Owner
Home Financials are based on the most recent Mortgage that was taken out on this home.
Original Mortgage
$380,000
Outstanding Balance
$304,592
Interest Rate
3.37%
Mortgage Type
Adjustable Rate Mortgage/ARM
Estimated Equity
$528,238
Purchase Details
Closed on
Apr 2, 2009
Sold by
Sanfelippo Kenneth and Sanfelippo Frances
Bought by
Sanfelippo Paul and Sanfelippo Kenneth
Create a Home Valuation Report for This Property
The Home Valuation Report is an in-depth analysis detailing your home's value as well as a comparison with similar homes in the area
Home Values in the Area
Average Home Value in this Area
Purchase History
| Date | Buyer | Sale Price | Title Company |
|---|---|---|---|
| Tung Tsui Kwan | $475,000 | Fidelity National Title Insu | |
| Sanfelippo Paul | -- | Fidelity Natl Title Ins Co |
Source: Public Records
Mortgage History
| Date | Status | Borrower | Loan Amount |
|---|---|---|---|
| Open | Tung Tsui Kwan | $380,000 |
Source: Public Records
Tax History Compared to Growth
Tax History
| Year | Tax Paid | Tax Assessment Tax Assessment Total Assessment is a certain percentage of the fair market value that is determined by local assessors to be the total taxable value of land and additions on the property. | Land | Improvement |
|---|---|---|---|---|
| 2025 | $7,219 | $56,400 | $6,120 | $50,280 |
| 2024 | $7,219 | $51,600 | $6,311 | $45,289 |
| 2023 | $7,004 | $34,488 | $6,141 | $28,347 |
| 2022 | $6,734 | $44,160 | $9,060 | $35,100 |
| 2021 | $6,697 | $44,220 | $9,060 | $35,160 |
| 2020 | $8,324 | $38,160 | $9,060 | $29,100 |
| 2019 | $6,266 | $37,200 | $9,060 | $28,140 |
| 2018 | $5,859 | $28,740 | $9,060 | $19,680 |
| 2017 | $5,730 | $28,111 | $8,843 | $19,268 |
| 2016 | $4,965 | $26,520 | $9,060 | $17,460 |
| 2015 | $4,493 | $26,457 | $6,916 | $19,541 |
| 2014 | $4,493 | $24,960 | $7,560 | $17,400 |
Source: Public Records
Map
Nearby Homes
- 2889 Amboy Rd
- 55 Amber St
- 194 Tysens Ln
- 56 Wolverine St
- 32 Mobile Ave
- 44 Thomas St
- 4 Penn Ave
- 126 Tysens Ln
- 28 Peter Ave
- 305 Tysens Ln Unit B
- 124 Barbara St
- 143 Wolverine St
- 122 Guyon Ave
- 207 Park St
- 77 Acorn St
- 45 Penn Ave
- 1915 N Railroad Ave
- 175 Amber St
- 100 Savoy St Unit 1, 39, 43, 45, 46
- 14 Savoy St Unit 14