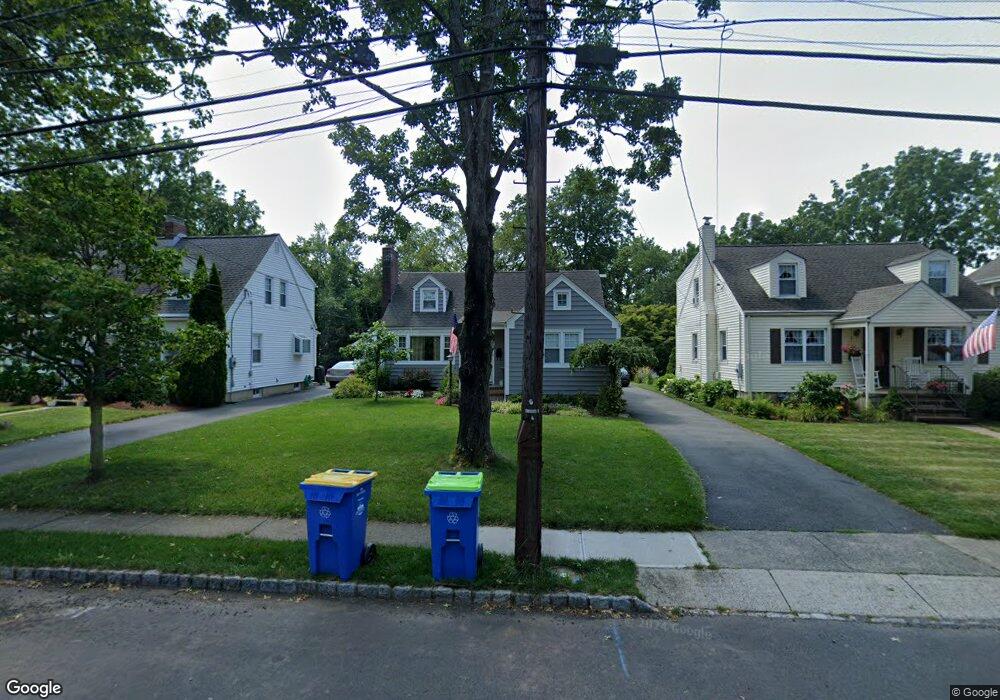
24 E Spring St Somerville, NJ 08876
Estimated Value: $483,000 - $591,000
Studio
--
Bath
1,451
Sq Ft
$379/Sq Ft
Est. Value
About This Home
This home is located at 24 E Spring St, Somerville, NJ 08876 and is currently estimated at $550,484, approximately $379 per square foot. 24 E Spring St is a home located in Somerset County with nearby schools including Van Derveer School, Somerville Middle School, and Somerville High School.
Ownership History
Date
Name
Owned For
Owner Type
Purchase Details
Closed on
Aug 25, 2005
Sold by
Stillwell Anthony
Bought by
Stabile Michael and Stabile Amy R
Current Estimated Value
Home Financials for this Owner
Home Financials are based on the most recent Mortgage that was taken out on this home.
Original Mortgage
$272,000
Outstanding Balance
$143,963
Interest Rate
5.68%
Estimated Equity
$406,521
Purchase Details
Closed on
Nov 27, 1996
Sold by
Krauth Lisa
Bought by
Stillwell Anthony
Home Financials for this Owner
Home Financials are based on the most recent Mortgage that was taken out on this home.
Original Mortgage
$50,000
Interest Rate
7.82%
Purchase Details
Closed on
Apr 30, 1996
Sold by
Kenzari Melissa
Bought by
Krauth Lisa
Home Financials for this Owner
Home Financials are based on the most recent Mortgage that was taken out on this home.
Original Mortgage
$122,000
Interest Rate
7.82%
Purchase Details
Closed on
Jul 20, 1992
Sold by
Teneyck Viola B
Bought by
Kenzari Kenzari H and Kenzari M
Create a Home Valuation Report for This Property
The Home Valuation Report is an in-depth analysis detailing your home's value as well as a comparison with similar homes in the area
Home Values in the Area
Average Home Value in this Area
Purchase History
| Date | Buyer | Sale Price | Title Company |
|---|---|---|---|
| Stabile Michael | $340,000 | -- | |
| Stillwell Anthony | $153,000 | -- | |
| Krauth Lisa | $153,000 | -- | |
| Kenzari Kenzari H | $135,000 | -- |
Source: Public Records
Mortgage History
| Date | Status | Borrower | Loan Amount |
|---|---|---|---|
| Open | Stabile Michael | $272,000 | |
| Previous Owner | Stillwell Anthony | $50,000 | |
| Previous Owner | Krauth Lisa | $122,000 |
Source: Public Records
Tax History
| Year | Tax Paid | Tax Assessment Tax Assessment Total Assessment is a certain percentage of the fair market value that is determined by local assessors to be the total taxable value of land and additions on the property. | Land | Improvement |
|---|---|---|---|---|
| 2025 | $12,025 | $304,200 | $133,400 | $170,800 |
| 2024 | $12,025 | $304,200 | $133,400 | $170,800 |
Source: Public Records
Map
Nearby Homes
- 28 E Spring St
- 20 E Spring St Unit 2nd floor
- 20 E Spring St Unit Upstairs
- 20 E Spring St
- 14 E Spring St
- 30 E Spring St
- 12 E Spring St
- 187 Grove St
- 25 E Spring St
- 191 Grove St Unit 193
- 183 Grove St
- 191-193 Grove St
- 27 E Spring St
- 17 E Spring St
- 180 N Bridge St
- 195 Grove St
- 182 N Bridge St Unit 184
- 182-184 N Bridge St
- 15 E Spring St
- 178 N Bridge St
Your Personal Tour Guide
Ask me questions while you tour the home.