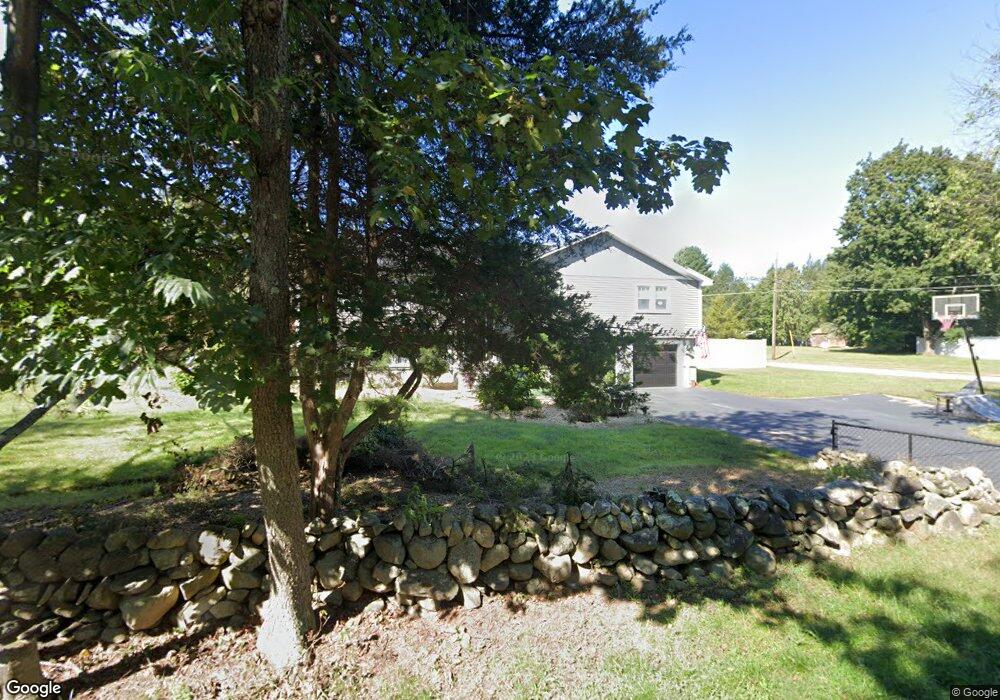
24 Ellis St Medway, MA 02053
Estimated Value: $710,016 - $911,000
4
Beds
4
Baths
2,700
Sq Ft
$292/Sq Ft
Est. Value
About This Home
This home is located at 24 Ellis St, Medway, MA 02053 and is currently estimated at $788,504, approximately $292 per square foot. 24 Ellis St is a home located in Norfolk County with nearby schools including John D. McGovern Elementary School, Burke-Memorial Elementary, and Medway Middle School.
Ownership History
Date
Name
Owned For
Owner Type
Purchase Details
Closed on
Jun 3, 2016
Sold by
Arnpriester Gregory S and Arnpriester Amy E
Bought by
Arnpiester Ft
Current Estimated Value
Purchase Details
Closed on
May 9, 2008
Sold by
Macswain David A
Bought by
Arnpriester Amy E and Arnpriester Gregory S
Home Financials for this Owner
Home Financials are based on the most recent Mortgage that was taken out on this home.
Original Mortgage
$290,000
Interest Rate
5.93%
Mortgage Type
Purchase Money Mortgage
Purchase Details
Closed on
Feb 28, 2007
Sold by
Lawrence Raymond A and Rapas Sandra L
Bought by
Macswain David A
Home Financials for this Owner
Home Financials are based on the most recent Mortgage that was taken out on this home.
Original Mortgage
$268,000
Interest Rate
6.27%
Mortgage Type
Purchase Money Mortgage
Create a Home Valuation Report for This Property
The Home Valuation Report is an in-depth analysis detailing your home's value as well as a comparison with similar homes in the area
Home Values in the Area
Average Home Value in this Area
Purchase History
| Date | Buyer | Sale Price | Title Company |
|---|---|---|---|
| Arnpiester Ft | -- | -- | |
| Arnpriester Amy E | $460,000 | -- | |
| Macswain David A | $335,000 | -- |
Source: Public Records
Mortgage History
| Date | Status | Borrower | Loan Amount |
|---|---|---|---|
| Previous Owner | Arnpriester Amy E | $290,000 | |
| Previous Owner | Macswain David A | $268,000 |
Source: Public Records
Tax History Compared to Growth
Tax History
| Year | Tax Paid | Tax Assessment Tax Assessment Total Assessment is a certain percentage of the fair market value that is determined by local assessors to be the total taxable value of land and additions on the property. | Land | Improvement |
|---|---|---|---|---|
| 2025 | $8,673 | $608,600 | $325,200 | $283,400 |
| 2024 | $8,764 | $608,600 | $325,200 | $283,400 |
| 2023 | $8,936 | $560,600 | $296,000 | $264,600 |
| 2022 | $7,830 | $462,500 | $218,900 | $243,600 |
| 2021 | $7,557 | $432,800 | $204,300 | $228,500 |
| 2020 | $7,513 | $429,300 | $204,300 | $225,000 |
| 2019 | $7,020 | $413,700 | $195,900 | $217,800 |
| 2018 | $7,098 | $401,900 | $187,600 | $214,300 |
| 2017 | $7,095 | $395,900 | $183,400 | $212,500 |
| 2016 | $6,107 | $337,200 | $168,800 | $168,400 |
| 2015 | $6,141 | $336,700 | $166,700 | $170,000 |
| 2014 | $5,989 | $317,900 | $166,700 | $151,200 |
Source: Public Records
Map
Nearby Homes
- 1 Walnut Ln
- 30 Broken Tree Rd
- 106 Holliston St
- 12 Lovering St
- 3 Meryl St
- 36 Lovering St
- 50 Main St
- 19 Sycamore Way Unit L40
- 22 Sunset Dr
- 14 Heritage Dr
- 0 Hill St
- 140 Goulding St
- 73 Orchard St
- 1 Jameson Dr Unit 1
- 3 Jameson Dr Unit 3
- 116 Winthrop St
- 625 Norfolk St
- 7 Hill St
- 6 Glen Ellen Blvd Unit 6
- 18 Lansing Way Unit 18