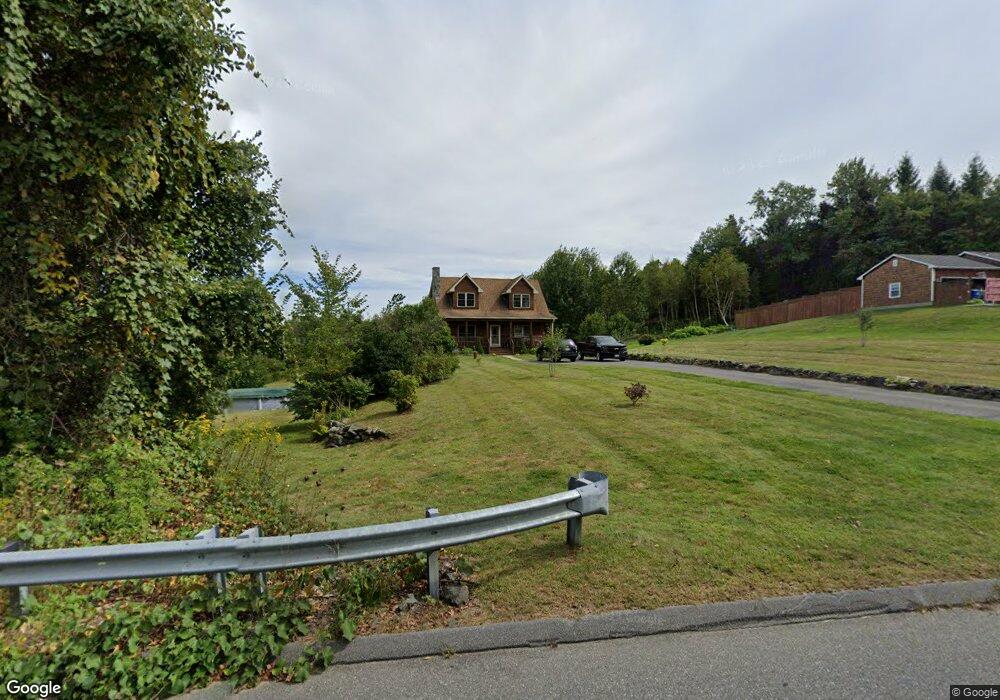
24 Ely Rd Monson, MA 01057
Estimated Value: $371,000 - $461,000
3
Beds
2
Baths
1,618
Sq Ft
$259/Sq Ft
Est. Value
About This Home
This home is located at 24 Ely Rd, Monson, MA 01057 and is currently estimated at $419,353, approximately $259 per square foot. 24 Ely Rd is a home located in Hampden County with nearby schools including Quarry Hill Community School, Granite Valley School, and Monson High School.
Ownership History
Date
Name
Owned For
Owner Type
Purchase Details
Closed on
Feb 28, 1989
Sold by
Downie Michael T
Bought by
Hamel Norman G
Current Estimated Value
Home Financials for this Owner
Home Financials are based on the most recent Mortgage that was taken out on this home.
Original Mortgage
$104,111
Interest Rate
10.75%
Mortgage Type
Purchase Money Mortgage
Purchase Details
Closed on
Jun 8, 1987
Sold by
Bushorr Robert T
Bought by
Downie Michael T
Home Financials for this Owner
Home Financials are based on the most recent Mortgage that was taken out on this home.
Original Mortgage
$82,800
Interest Rate
10.38%
Mortgage Type
Purchase Money Mortgage
Create a Home Valuation Report for This Property
The Home Valuation Report is an in-depth analysis detailing your home's value as well as a comparison with similar homes in the area
Home Values in the Area
Average Home Value in this Area
Purchase History
| Date | Buyer | Sale Price | Title Company |
|---|---|---|---|
| Hamel Norman G | $103,000 | -- | |
| Downie Michael T | $92,000 | -- |
Source: Public Records
Mortgage History
| Date | Status | Borrower | Loan Amount |
|---|---|---|---|
| Open | Downie Michael T | $10,000 | |
| Closed | Downie Michael T | $103,550 | |
| Closed | Downie Michael T | $104,111 | |
| Previous Owner | Downie Michael T | $82,800 |
Source: Public Records
Tax History
| Year | Tax Paid | Tax Assessment Tax Assessment Total Assessment is a certain percentage of the fair market value that is determined by local assessors to be the total taxable value of land and additions on the property. | Land | Improvement |
|---|---|---|---|---|
| 2025 | $5,676 | $381,700 | $68,300 | $313,400 |
| 2024 | $5,577 | $359,800 | $68,300 | $291,500 |
| 2023 | $5,389 | $339,800 | $68,300 | $271,500 |
| 2022 | $5,158 | $289,300 | $68,300 | $221,000 |
| 2021 | $4,912 | $271,100 | $68,300 | $202,800 |
| 2020 | $4,953 | $271,100 | $68,300 | $202,800 |
| 2019 | $4,759 | $259,500 | $68,300 | $191,200 |
| 2018 | $350 | $255,300 | $75,700 | $179,600 |
| 2017 | $4,290 | $246,400 | $72,600 | $173,800 |
| 2016 | $3,939 | $230,100 | $68,500 | $161,600 |
| 2015 | $3,836 | $230,100 | $68,500 | $161,600 |
| 2014 | $3,728 | $230,100 | $68,500 | $161,600 |
Source: Public Records
Map
Nearby Homes
Your Personal Tour Guide
Ask me questions while you tour the home.