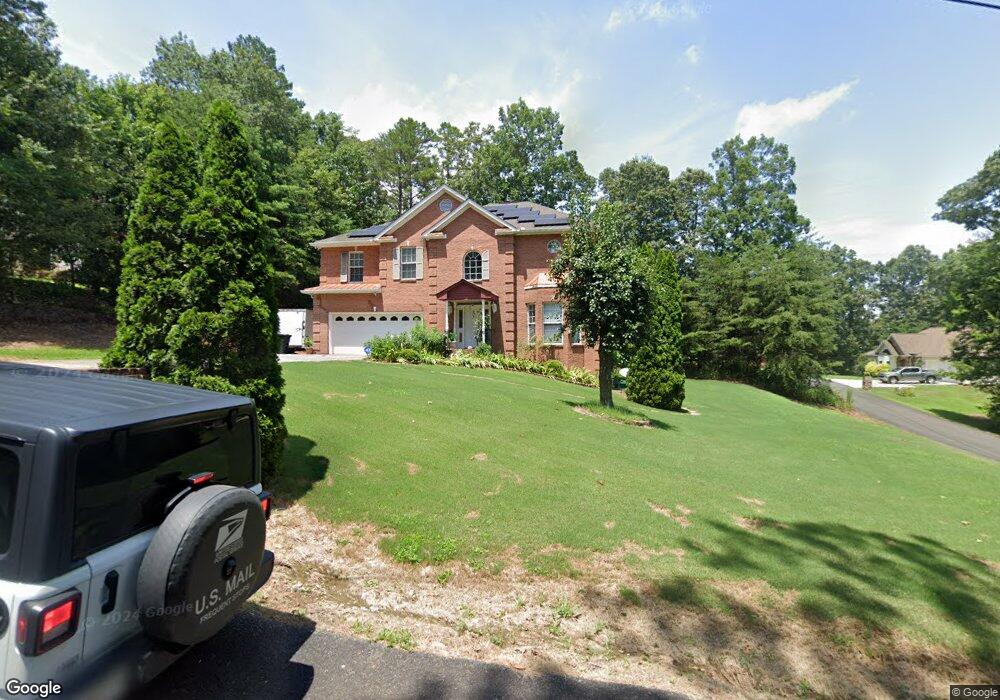
24 Eric Ln Ellijay, GA 30536
Estimated Value: $520,000 - $758,000
4
Beds
3
Baths
3,826
Sq Ft
$164/Sq Ft
Est. Value
About This Home
This home is located at 24 Eric Ln, Ellijay, GA 30536 and is currently estimated at $628,834, approximately $164 per square foot. 24 Eric Ln is a home located in Gilmer County with nearby schools including Ellijay Elementary School, Gilmer Middle School, and Clear Creek Elementary School.
Ownership History
Date
Name
Owned For
Owner Type
Purchase Details
Closed on
Dec 31, 2020
Sold by
Le Trung
Bought by
Tran Minhloan Thi
Current Estimated Value
Home Financials for this Owner
Home Financials are based on the most recent Mortgage that was taken out on this home.
Original Mortgage
$203,000
Outstanding Balance
$179,930
Interest Rate
2.71%
Mortgage Type
New Conventional
Estimated Equity
$448,904
Purchase Details
Closed on
Dec 12, 2007
Sold by
Le Trung
Bought by
Le Trung and Tran Phoung T
Purchase Details
Closed on
Oct 26, 2006
Sold by
Akmal Muhammad M
Bought by
Le Trung
Home Financials for this Owner
Home Financials are based on the most recent Mortgage that was taken out on this home.
Original Mortgage
$260,000
Interest Rate
6.27%
Mortgage Type
New Conventional
Purchase Details
Closed on
Apr 8, 2002
Sold by
Emuel Sanford Elect & Plumbing Inc
Bought by
Akmal Muhammad M and Akmal Sobia M
Purchase Details
Closed on
Apr 29, 1998
Sold by
Sanford Emuel
Bought by
Sanford Emuel Electric & Plumbing Inc
Create a Home Valuation Report for This Property
The Home Valuation Report is an in-depth analysis detailing your home's value as well as a comparison with similar homes in the area
Home Values in the Area
Average Home Value in this Area
Purchase History
| Date | Buyer | Sale Price | Title Company |
|---|---|---|---|
| Tran Minhloan Thi | $332,000 | -- | |
| Le Trung | -- | -- | |
| Le Trung | $325,000 | -- | |
| Akmal Muhammad M | $247,000 | -- | |
| Sanford Emuel Electric & Plumbing Inc | $96,000 | -- |
Source: Public Records
Mortgage History
| Date | Status | Borrower | Loan Amount |
|---|---|---|---|
| Open | Tran Minhloan Thi | $203,000 | |
| Previous Owner | Le Trung | $260,000 |
Source: Public Records
Tax History
| Year | Tax Paid | Tax Assessment Tax Assessment Total Assessment is a certain percentage of the fair market value that is determined by local assessors to be the total taxable value of land and additions on the property. | Land | Improvement |
|---|---|---|---|---|
| 2025 | $3,981 | $257,640 | $8,800 | $248,840 |
| 2024 | $3,953 | $255,120 | $8,800 | $246,320 |
| 2023 | $4,055 | $253,520 | $7,200 | $246,320 |
| 2022 | $3,575 | $203,160 | $7,200 | $195,960 |
| 2021 | $3,117 | $157,040 | $7,200 | $149,840 |
| 2020 | $3,098 | $140,840 | $7,200 | $133,640 |
| 2019 | $3,189 | $140,840 | $7,200 | $133,640 |
| 2018 | $3,158 | $137,640 | $4,000 | $133,640 |
| 2017 | $2,696 | $109,600 | $4,000 | $105,600 |
| 2016 | $2,780 | $110,760 | $4,000 | $106,760 |
| 2015 | $2,602 | $105,560 | $4,000 | $101,560 |
| 2014 | $2,571 | $100,320 | $4,000 | $96,320 |
| 2013 | -- | $100,160 | $4,000 | $96,160 |
Source: Public Records
Map
Nearby Homes
- 6.44 Whispering Oaks Dr
- LT 10R Whispering Oaks Dr Unit 10R
- LT 11 Whispering Oaks Dr
- LT 10R Whispering Oaks Dr
- 3.12 ACR Eric Ln
- LOT 3 Ridgehaven Trail
- Lot 3 Ridgehaven Trail
- lot 123 Ridgehaven Trail
- BUILDING 8 Ridgehaven Trail
- 269 Old Orchard Rd
- 0 Aspen Ave Unit 10501189
- 0 Aspen Ave Unit 1025047
- 291 Aspen Ave
- LOT 17 Misty Mountain Trail
- 40 Cherry St
- TR-A 1st Ave
- 63 Granny Smith Ln
- 63 Granny Smith Ln Unit 84
- 2641 Highway 52 E
- 216 Old Orchard Square
- 0 Eric Ln Unit 5993078
- 0 Eric Ln Unit 5993059
- N Whispering Oaks Dr
- N Whispering Oaks
- 120 Whispering Oaks Dr
- 40 Eric Ln
- 64 Eric Ln
- 15 Eric Ln
- 15 Eric Ln
- 153 Whispering Oaks Dr
- 168 Whispering Oaks Dr
- W Eric Ln
- 57 Eric Ln
- 71 Eric Ln
- 182 Whispering Oaks Dr
- 178 Whispering Oaks Dr
- 178 Whispering Oaks Dr Unit 5
- 11 Whispering Oaks Dr
- 373 Old Bennett Rd
- 527 Old Bennett Rd
Your Personal Tour Guide
Ask me questions while you tour the home.