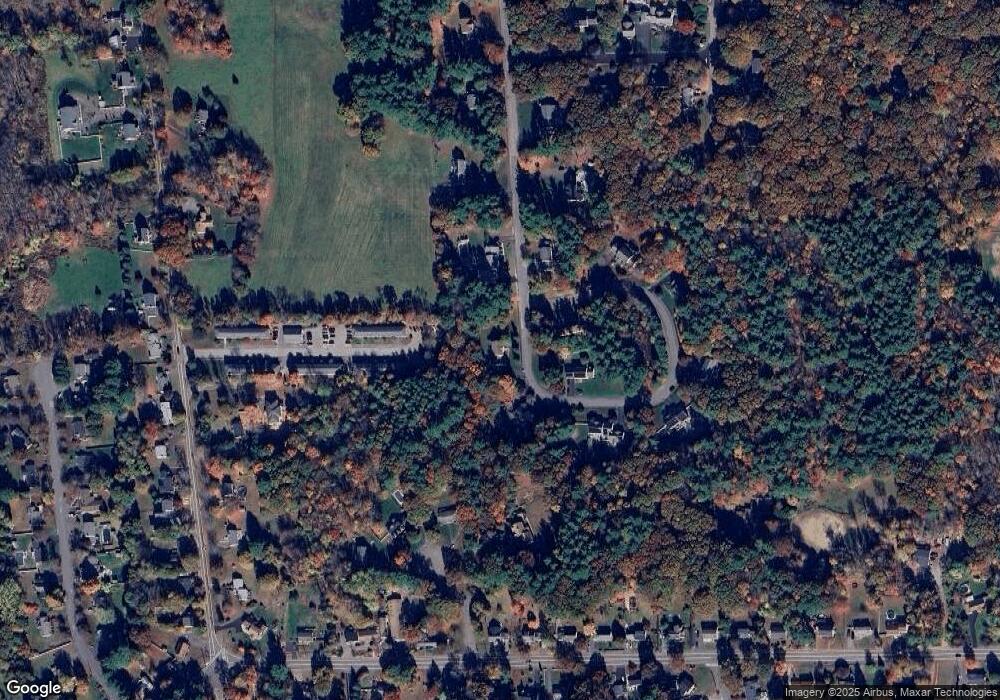
24 Field Rd Medway, MA 02053
Estimated Value: $935,000 - $1,151,000
4
Beds
3
Baths
2,864
Sq Ft
$359/Sq Ft
Est. Value
About This Home
This home is located at 24 Field Rd, Medway, MA 02053 and is currently estimated at $1,029,049, approximately $359 per square foot. 24 Field Rd is a home located in Norfolk County with nearby schools including John D. McGovern Elementary School, Burke-Memorial Elementary, and Medway Middle School.
Ownership History
Date
Name
Owned For
Owner Type
Purchase Details
Closed on
Sep 19, 2002
Sold by
Parallel Inc
Bought by
Mitchell Charles M and Mitchell Trinette M
Current Estimated Value
Home Financials for this Owner
Home Financials are based on the most recent Mortgage that was taken out on this home.
Original Mortgage
$275,000
Outstanding Balance
$115,882
Interest Rate
6.36%
Mortgage Type
Purchase Money Mortgage
Estimated Equity
$913,167
Create a Home Valuation Report for This Property
The Home Valuation Report is an in-depth analysis detailing your home's value as well as a comparison with similar homes in the area
Home Values in the Area
Average Home Value in this Area
Purchase History
| Date | Buyer | Sale Price | Title Company |
|---|---|---|---|
| Mitchell Charles M | $500,297 | -- | |
| Parallel Inc | $80,000 | -- |
Source: Public Records
Mortgage History
| Date | Status | Borrower | Loan Amount |
|---|---|---|---|
| Open | Mitchell Charles M | $275,000 |
Source: Public Records
Tax History Compared to Growth
Tax History
| Year | Tax Paid | Tax Assessment Tax Assessment Total Assessment is a certain percentage of the fair market value that is determined by local assessors to be the total taxable value of land and additions on the property. | Land | Improvement |
|---|---|---|---|---|
| 2025 | $11,786 | $827,100 | $339,900 | $487,200 |
| 2024 | $11,910 | $827,100 | $339,900 | $487,200 |
| 2023 | $11,705 | $734,300 | $309,400 | $424,900 |
| 2022 | $10,905 | $644,100 | $228,800 | $415,300 |
| 2021 | $10,871 | $622,600 | $213,500 | $409,100 |
| 2020 | $10,841 | $619,500 | $213,500 | $406,000 |
| 2019 | $10,114 | $596,000 | $204,800 | $391,200 |
| 2018 | $10,379 | $587,700 | $204,800 | $382,900 |
| 2017 | $10,207 | $569,600 | $196,100 | $373,500 |
| 2016 | $9,731 | $537,300 | $185,200 | $352,100 |
| 2015 | $9,693 | $531,400 | $185,200 | $346,200 |
| 2014 | $8,953 | $475,200 | $185,200 | $290,000 |
Source: Public Records
Map
Nearby Homes