Estimated Value: $540,968 - $651,000
2
Beds
1
Bath
1,091
Sq Ft
$550/Sq Ft
Est. Value
About This Home
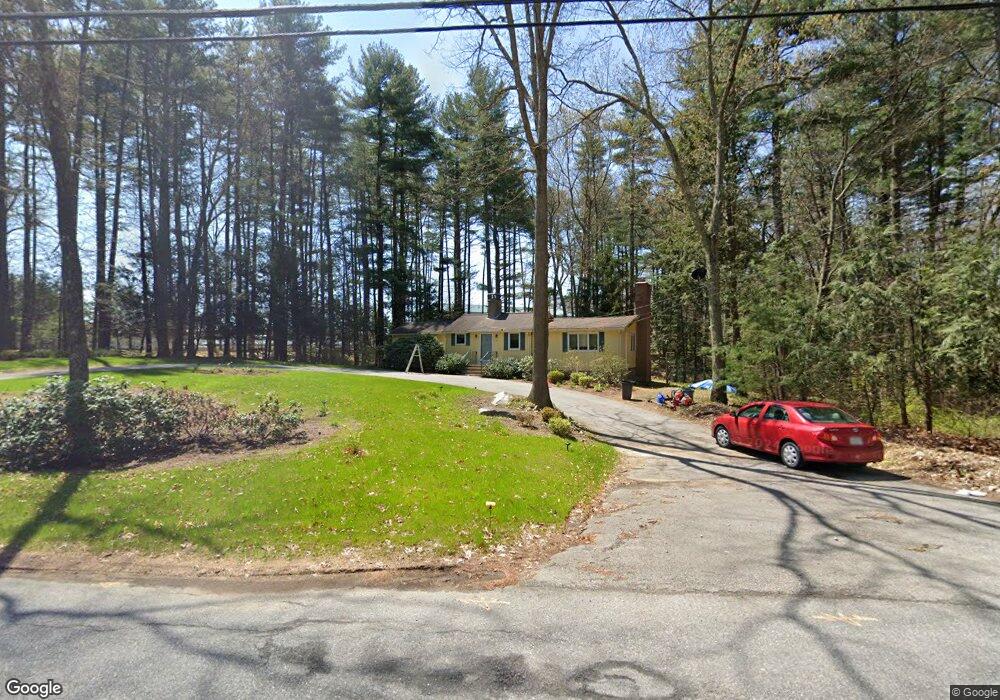
This home is located at 24 Forest Rd, Acton, MA 01720 and is currently estimated at $600,492, approximately $550 per square foot. 24 Forest Rd is a home located in Middlesex County with nearby schools including Acton-Boxborough Regional High School and Nashoba Brooks School.
Ownership History
Date
Name
Owned For
Owner Type
Purchase Details
Closed on
Jan 14, 2010
Sold by
Mcneil Alyce L and Mcneil Martha M
Bought by
Mcneil Alyce L
Current Estimated Value
Home Financials for this Owner
Home Financials are based on the most recent Mortgage that was taken out on this home.
Original Mortgage
$70,000
Outstanding Balance
$45,396
Interest Rate
4.71%
Mortgage Type
Purchase Money Mortgage
Estimated Equity
$555,096
Purchase Details
Closed on
Jul 25, 1986
Bought by
Mcneil Alyce L
Create a Home Valuation Report for This Property
The Home Valuation Report is an in-depth analysis detailing your home's value as well as a comparison with similar homes in the area
Home Values in the Area
Average Home Value in this Area
Purchase History
| Date | Buyer | Sale Price | Title Company |
|---|---|---|---|
| Mcneil Alyce L | -- | -- | |
| Mcneil Alyce L | $144,600 | -- |
Source: Public Records
Mortgage History
| Date | Status | Borrower | Loan Amount |
|---|---|---|---|
| Open | Mcneil Alyce L | $70,000 | |
| Previous Owner | Mcneil Alyce L | $122,000 | |
| Previous Owner | Mcneil Alyce L | $132,000 | |
| Previous Owner | Mcneil Alyce L | $135,000 |
Source: Public Records
Tax History
| Year | Tax Paid | Tax Assessment Tax Assessment Total Assessment is a certain percentage of the fair market value that is determined by local assessors to be the total taxable value of land and additions on the property. | Land | Improvement |
|---|---|---|---|---|
| 2025 | $8,330 | $485,700 | $327,500 | $158,200 |
| 2024 | $7,977 | $478,500 | $327,500 | $151,000 |
| 2023 | $7,626 | $434,300 | $297,800 | $136,500 |
| 2022 | $7,504 | $385,800 | $259,000 | $126,800 |
| 2021 | $7,186 | $355,200 | $239,600 | $115,600 |
| 2020 | $6,771 | $351,900 | $239,600 | $112,300 |
| 2019 | $6,450 | $333,000 | $239,600 | $93,400 |
| 2018 | $6,196 | $319,700 | $239,600 | $80,100 |
| 2017 | $6,093 | $319,700 | $239,600 | $80,100 |
| 2016 | $5,919 | $307,800 | $239,600 | $68,200 |
| 2015 | $5,877 | $308,500 | $239,600 | $68,900 |
| 2014 | $5,944 | $305,600 | $239,600 | $66,000 |
Source: Public Records
Map
Nearby Homes
Your Personal Tour Guide
Ask me questions while you tour the home.