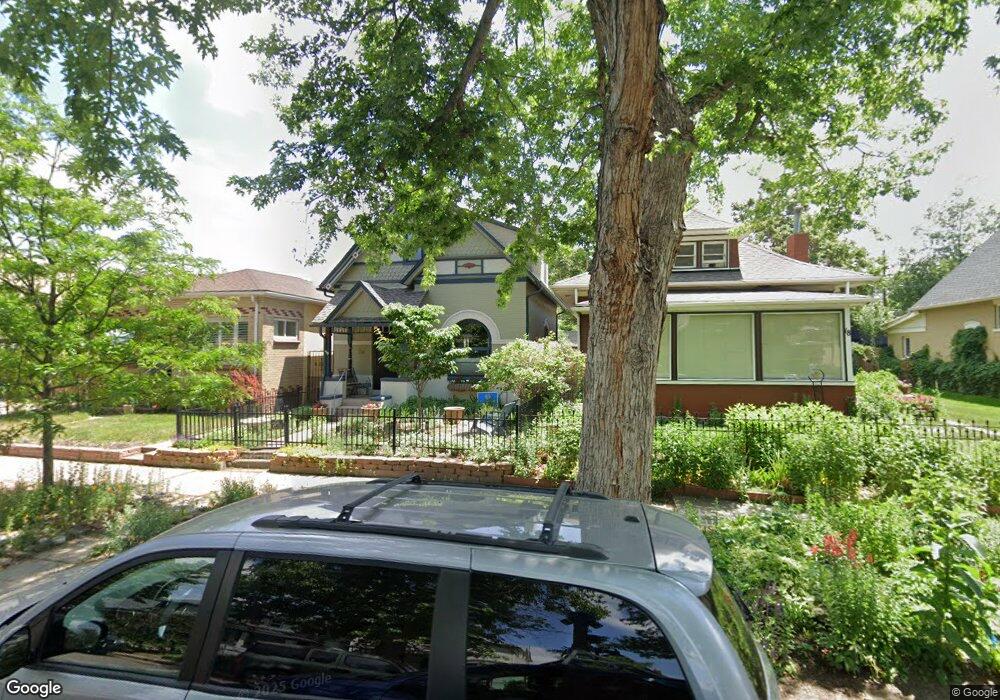
24 Fox St Denver, CO 80223
Baker NeighborhoodEstimated Value: $542,108 - $614,000
3
Beds
2
Baths
1,113
Sq Ft
$522/Sq Ft
Est. Value
About This Home
This home is located at 24 Fox St, Denver, CO 80223 and is currently estimated at $581,027, approximately $522 per square foot. 24 Fox St is a home located in Denver County with nearby schools including Kepner Beacon Middle School, West High School, and Girls Athletic Leadership School.
Ownership History
Date
Name
Owned For
Owner Type
Purchase Details
Closed on
Sep 11, 2023
Sold by
Rasco Robin R
Bought by
Robin R Rasco Revocable Trust
Current Estimated Value
Purchase Details
Closed on
Oct 9, 2009
Sold by
Smith Calvin L
Bought by
Rasco Robin R
Home Financials for this Owner
Home Financials are based on the most recent Mortgage that was taken out on this home.
Original Mortgage
$267,000
Interest Rate
5.03%
Mortgage Type
New Conventional
Create a Home Valuation Report for This Property
The Home Valuation Report is an in-depth analysis detailing your home's value as well as a comparison with similar homes in the area
Home Values in the Area
Average Home Value in this Area
Purchase History
| Date | Buyer | Sale Price | Title Company |
|---|---|---|---|
| Robin R Rasco Revocable Trust | -- | None Listed On Document | |
| Rasco Robin R | $267,000 | None Available |
Source: Public Records
Mortgage History
| Date | Status | Borrower | Loan Amount |
|---|---|---|---|
| Previous Owner | Rasco Robin R | $267,000 |
Source: Public Records
Tax History
| Year | Tax Paid | Tax Assessment Tax Assessment Total Assessment is a certain percentage of the fair market value that is determined by local assessors to be the total taxable value of land and additions on the property. | Land | Improvement |
|---|---|---|---|---|
| 2025 | $2,824 | $38,600 | $23,070 | $23,070 |
| 2024 | $2,824 | $35,660 | $18,240 | $17,420 |
| 2023 | $2,763 | $35,660 | $18,240 | $17,420 |
| 2022 | $2,504 | $31,490 | $19,330 | $12,160 |
| 2021 | $2,418 | $32,400 | $19,890 | $12,510 |
| 2020 | $2,163 | $29,150 | $13,460 | $15,690 |
| 2019 | $2,102 | $29,150 | $13,460 | $15,690 |
| 2018 | $1,849 | $23,900 | $10,020 | $13,880 |
| 2017 | $1,844 | $23,900 | $10,020 | $13,880 |
| 2016 | $1,723 | $21,130 | $8,469 | $12,661 |
| 2015 | $1,651 | $21,130 | $8,469 | $12,661 |
| 2014 | $1,372 | $16,520 | $2,476 | $14,044 |
Source: Public Records
Map
Nearby Homes
- 23 Fox St
- 48 Galapago St
- 7 Elati St
- 5 S Elati St Unit 3
- 126 Galapago St
- 117 Elati St Unit 3
- 729 W 1st Ave
- 145 S Cherokee St
- 137 W Irvington Place
- 257 Cherokee St
- 314 Galapago St
- 321 Fox St
- 315 Galapago St
- 308 Inca St
- 172 W Maple Ave
- 120 W Bayaud Ave
- 110 W Bayaud Ave
- 60 S Bannock St
- 321 Inca St
- 62 S Bannock St
Your Personal Tour Guide
Ask me questions while you tour the home.