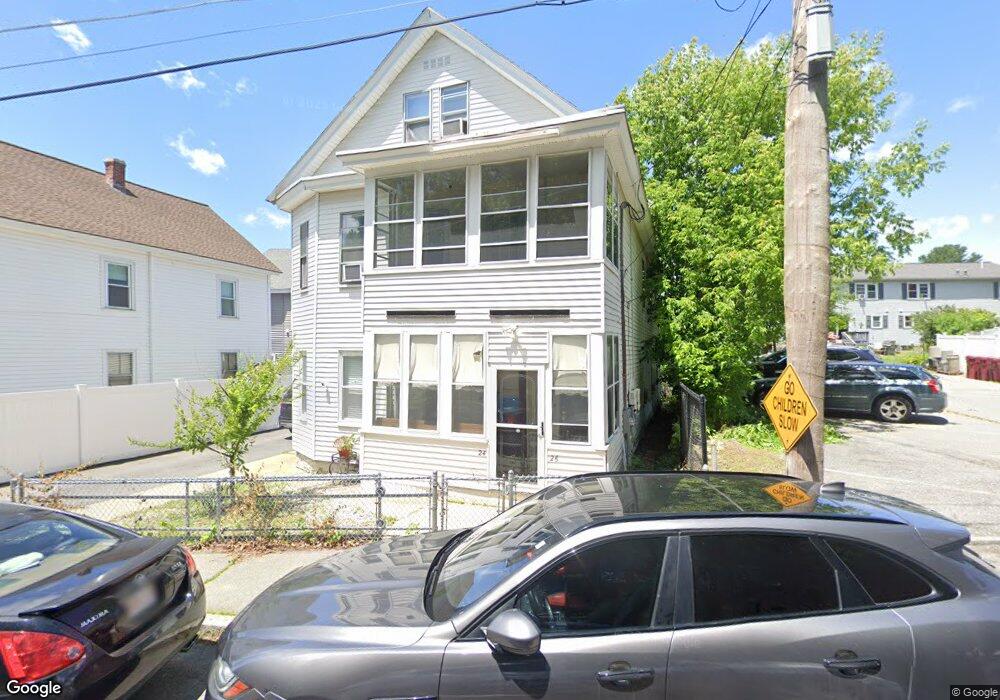
24 Fred St Lowell, MA 01850
Centralville NeighborhoodEstimated Value: $601,000 - $723,000
6
Beds
2
Baths
2,604
Sq Ft
$247/Sq Ft
Est. Value
About This Home
This home is located at 24 Fred St, Lowell, MA 01850 and is currently estimated at $642,816, approximately $246 per square foot. 24 Fred St is a home located in Middlesex County with nearby schools including Greenhalge Elementary School, S. Christa McAuliffe Elementary School, and Moody Elementary School.
Ownership History
Date
Name
Owned For
Owner Type
Purchase Details
Closed on
Dec 7, 2015
Sold by
Khoeun Sam O
Bought by
Khoeun Sam O and Puth Narin
Current Estimated Value
Home Financials for this Owner
Home Financials are based on the most recent Mortgage that was taken out on this home.
Original Mortgage
$284,747
Outstanding Balance
$223,043
Interest Rate
3.75%
Mortgage Type
FHA
Estimated Equity
$419,773
Purchase Details
Closed on
Dec 1, 2015
Sold by
Prak Visuth and Lin Srou
Bought by
Khoeun Sam O
Home Financials for this Owner
Home Financials are based on the most recent Mortgage that was taken out on this home.
Original Mortgage
$284,747
Outstanding Balance
$223,043
Interest Rate
3.75%
Mortgage Type
FHA
Estimated Equity
$419,773
Purchase Details
Closed on
May 9, 2011
Sold by
Kucek Ft and Kucek
Bought by
Prak Visuth
Home Financials for this Owner
Home Financials are based on the most recent Mortgage that was taken out on this home.
Original Mortgage
$199,803
Interest Rate
5.25%
Mortgage Type
FHA
Purchase Details
Closed on
Dec 21, 2007
Sold by
Kucek Walter J
Bought by
Kucek Ft and Kucek
Create a Home Valuation Report for This Property
The Home Valuation Report is an in-depth analysis detailing your home's value as well as a comparison with similar homes in the area
Home Values in the Area
Average Home Value in this Area
Purchase History
| Date | Buyer | Sale Price | Title Company |
|---|---|---|---|
| Khoeun Sam O | -- | -- | |
| Khoeun Sam O | -- | -- | |
| Khoeun Sam O | $290,000 | -- | |
| Prak Visuth | $205,000 | -- | |
| Prak Visuth | $205,000 | -- | |
| Prak Visuth | $205,000 | -- | |
| Kucek Ft | -- | -- | |
| Kucek Ft | -- | -- |
Source: Public Records
Mortgage History
| Date | Status | Borrower | Loan Amount |
|---|---|---|---|
| Open | Khoeun Sam O | $284,747 | |
| Closed | Kucek Ft | $284,747 | |
| Previous Owner | Prak Visuth | $199,803 |
Source: Public Records
Tax History
| Year | Tax Paid | Tax Assessment Tax Assessment Total Assessment is a certain percentage of the fair market value that is determined by local assessors to be the total taxable value of land and additions on the property. | Land | Improvement |
|---|---|---|---|---|
| 2025 | $7,367 | $641,700 | $118,400 | $523,300 |
| 2024 | $6,765 | $568,000 | $105,700 | $462,300 |
| 2023 | $6,221 | $500,900 | $85,500 | $415,400 |
| 2022 | $5,703 | $449,400 | $73,900 | $375,500 |
| 2021 | $5,287 | $392,800 | $64,200 | $328,600 |
| 2020 | $5,049 | $377,900 | $75,200 | $302,700 |
| 2019 | $4,508 | $321,100 | $62,600 | $258,500 |
| 2018 | $4,187 | $291,000 | $59,600 | $231,400 |
| 2017 | $3,887 | $260,500 | $49,500 | $211,000 |
| 2016 | $3,400 | $224,300 | $45,800 | $178,500 |
| 2015 | $3,116 | $201,300 | $45,800 | $155,500 |
| 2013 | $2,780 | $185,200 | $52,800 | $132,400 |
Source: Public Records
Map
Nearby Homes
- 930 Lakeview Ave
- 26 Farmland Rd Unit C
- 417 Hildreth St Unit 30
- 361 Hildreth St Unit 24
- 367 Hildreth St Unit 33
- 75 Sladen St
- 35 Riverwalk Way Unit 103
- 508 Lakeview Ave
- 27 Bunker Hill Ave
- 202 Coburn St
- 52 Lawrence Dr Unit 305
- 52 Lawrence Dr Unit 206
- 551 Hildreth St Unit 21
- 551 Hildreth St Unit 10
- 39 Phoebe Ave
- 1 19th St Unit 3
- 23 18th St
- 28 Sarah Ave
- 35 Whitney Ave Unit 33
- 174 River Rd
Your Personal Tour Guide
Ask me questions while you tour the home.