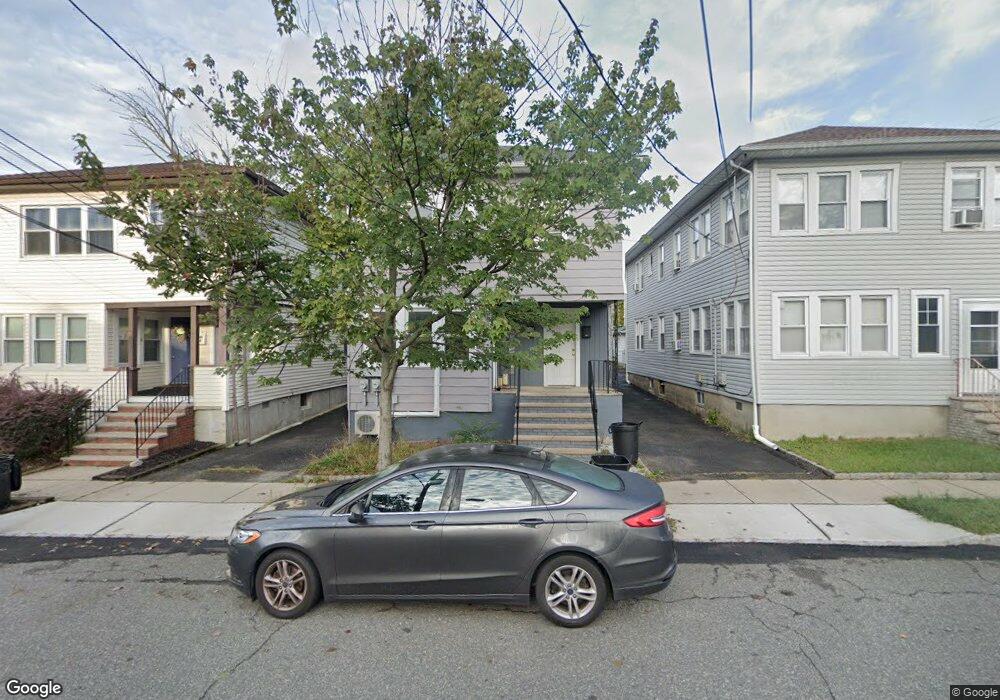
24 Fremont St Unit 1 Montclair, NJ 07042
Estimated Value: $673,000 - $788,000
3
Beds
1
Bath
1,000
Sq Ft
$729/Sq Ft
Est. Value
About This Home
This home is located at 24 Fremont St Unit 1, Montclair, NJ 07042 and is currently estimated at $728,748, approximately $728 per square foot. 24 Fremont St Unit 1 is a home located in Essex County with nearby schools including Hillside School, Bradford School, and Charles H. Bullock School.
Ownership History
Date
Name
Owned For
Owner Type
Purchase Details
Closed on
Aug 19, 2024
Sold by
24 Fremont St Llc
Bought by
Mala Aimad and Ouissal Taabane
Current Estimated Value
Home Financials for this Owner
Home Financials are based on the most recent Mortgage that was taken out on this home.
Original Mortgage
$618,750
Outstanding Balance
$611,613
Interest Rate
6.77%
Mortgage Type
New Conventional
Estimated Equity
$117,135
Purchase Details
Closed on
Jun 27, 2023
Sold by
24 Fremont Llc
Bought by
24 Fremont St Llc
Home Financials for this Owner
Home Financials are based on the most recent Mortgage that was taken out on this home.
Original Mortgage
$520,000
Interest Rate
6.57%
Mortgage Type
Seller Take Back
Purchase Details
Closed on
Feb 1, 2022
Sold by
Rawls Tedious
Bought by
24 Fremont Llc
Purchase Details
Closed on
Apr 14, 2005
Create a Home Valuation Report for This Property
The Home Valuation Report is an in-depth analysis detailing your home's value as well as a comparison with similar homes in the area
Home Values in the Area
Average Home Value in this Area
Purchase History
| Date | Buyer | Sale Price | Title Company |
|---|---|---|---|
| Mala Aimad | -- | Elite Title | |
| 24 Fremont St Llc | $620,000 | None Listed On Document | |
| 24 Fremont Llc | $500,000 | None Listed On Document | |
| -- | $300,000 | -- |
Source: Public Records
Mortgage History
| Date | Status | Borrower | Loan Amount |
|---|---|---|---|
| Open | Mala Aimad | $618,750 | |
| Previous Owner | 24 Fremont St Llc | $520,000 |
Source: Public Records
Tax History Compared to Growth
Tax History
| Year | Tax Paid | Tax Assessment Tax Assessment Total Assessment is a certain percentage of the fair market value that is determined by local assessors to be the total taxable value of land and additions on the property. | Land | Improvement |
|---|---|---|---|---|
| 2025 | $11,864 | $351,000 | $166,200 | $184,800 |
| 2024 | $11,864 | $351,000 | $166,200 | $184,800 |
| 2022 | $11,541 | $351,000 | $166,200 | $184,800 |
| 2021 | $11,341 | $351,000 | $166,200 | $184,800 |
| 2020 | $11,158 | $351,000 | $166,200 | $184,800 |
| 2019 | $11,042 | $351,000 | $166,200 | $184,800 |
| 2018 | $10,860 | $351,000 | $166,200 | $184,800 |
| 2017 | $8,935 | $239,300 | $92,700 | $146,600 |
| 2016 | $8,696 | $239,300 | $92,700 | $146,600 |
| 2015 | $8,438 | $239,300 | $92,700 | $146,600 |
| 2014 | $8,155 | $239,300 | $92,700 | $146,600 |
Source: Public Records
Map
Nearby Homes
- 5 Franklin Ave
- 7 Franklin Ave
- 2 Fremont St
- 42 Franklin Place
- 7 Virginia Ave
- 29 Enfield Ave
- 194 Harrison Ave
- 3 Winfield St
- 77 Harrison Ave Unit 79
- 79 Harrison Ave
- 175 Harrison Ave
- 102 Harrison Ave
- 132 Franklin Ave
- 107 High St
- 110 Whittlesey Ave
- 36 William St
- 350 Main St
- 9 Rosedale Ave
- 438 Washington Ave
- 17 Parkside Ave