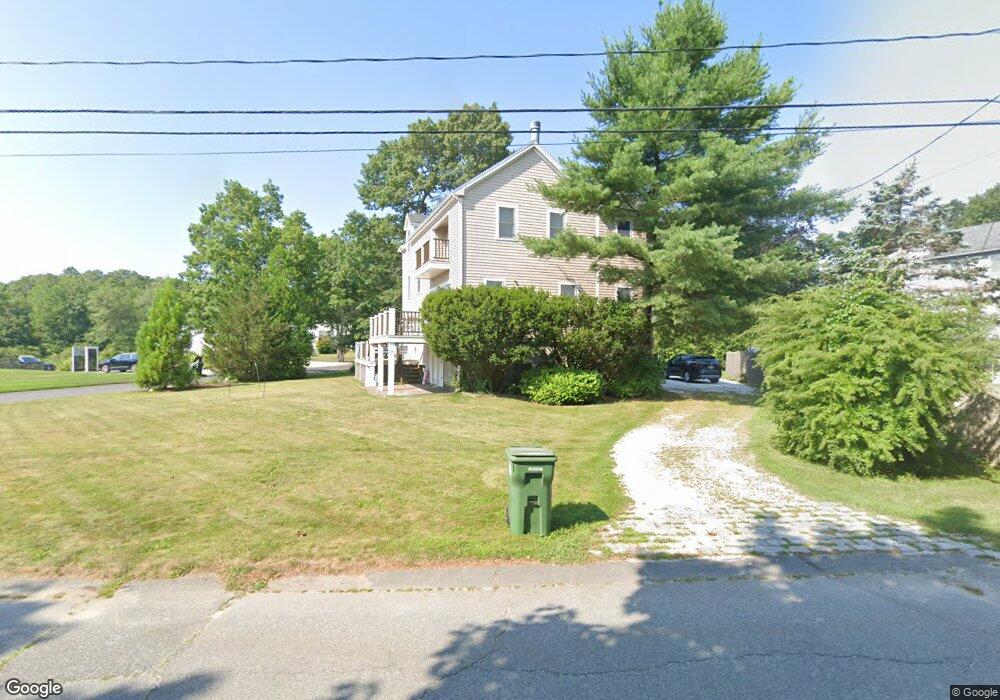
24 Front St Marion, MA 02738
Marion Center NeighborhoodEstimated Value: $1,113,000 - $1,477,000
4
Beds
3
Baths
2,664
Sq Ft
$496/Sq Ft
Est. Value
About This Home
This home is located at 24 Front St, Marion, MA 02738 and is currently estimated at $1,321,236, approximately $495 per square foot. 24 Front St is a home located in Plymouth County with nearby schools including Old Rochester Regional High School and Tabor Academy.
Ownership History
Date
Name
Owned For
Owner Type
Purchase Details
Closed on
Mar 10, 2021
Sold by
Young Lucy H and Gaissert Henning A
Bought by
Zora Ventures Llc
Current Estimated Value
Purchase Details
Closed on
Sep 13, 2002
Sold by
Roust Edward D
Bought by
Young Lucy H and Gaissert Henning A
Home Financials for this Owner
Home Financials are based on the most recent Mortgage that was taken out on this home.
Original Mortgage
$383,500
Interest Rate
6.48%
Mortgage Type
Purchase Money Mortgage
Create a Home Valuation Report for This Property
The Home Valuation Report is an in-depth analysis detailing your home's value as well as a comparison with similar homes in the area
Home Values in the Area
Average Home Value in this Area
Purchase History
| Date | Buyer | Sale Price | Title Company |
|---|---|---|---|
| Zora Ventures Llc | -- | None Available | |
| Young Lucy H | $547,900 | -- |
Source: Public Records
Mortgage History
| Date | Status | Borrower | Loan Amount |
|---|---|---|---|
| Previous Owner | Young Lucy H | $400,000 | |
| Previous Owner | Young Lucy H | $562,500 | |
| Previous Owner | Young Lucy H | $376,800 | |
| Previous Owner | Young Lucy H | $383,500 |
Source: Public Records
Tax History
| Year | Tax Paid | Tax Assessment Tax Assessment Total Assessment is a certain percentage of the fair market value that is determined by local assessors to be the total taxable value of land and additions on the property. | Land | Improvement |
|---|---|---|---|---|
| 2025 | $12,489 | $1,340,035 | $765,635 | $574,400 |
| 2024 | $11,271 | $1,217,158 | $699,058 | $518,100 |
| 2023 | $10,842 | $1,148,526 | $649,126 | $499,400 |
| 2022 | $10,847 | $999,716 | $688,116 | $311,600 |
| 2021 | $10,665 | $942,162 | $623,062 | $319,100 |
| 2020 | $9,553 | $816,500 | $497,400 | $319,100 |
| 2019 | $8,350 | $757,000 | $452,900 | $304,100 |
| 2018 | $9,042 | $789,700 | $495,200 | $294,500 |
| 2017 | $9,010 | $789,700 | $495,200 | $294,500 |
| 2016 | $9,145 | $808,600 | $495,200 | $313,400 |
| 2015 | $8,799 | $792,000 | $493,700 | $298,300 |
Source: Public Records
Map
Nearby Homes
Your Personal Tour Guide
Ask me questions while you tour the home.