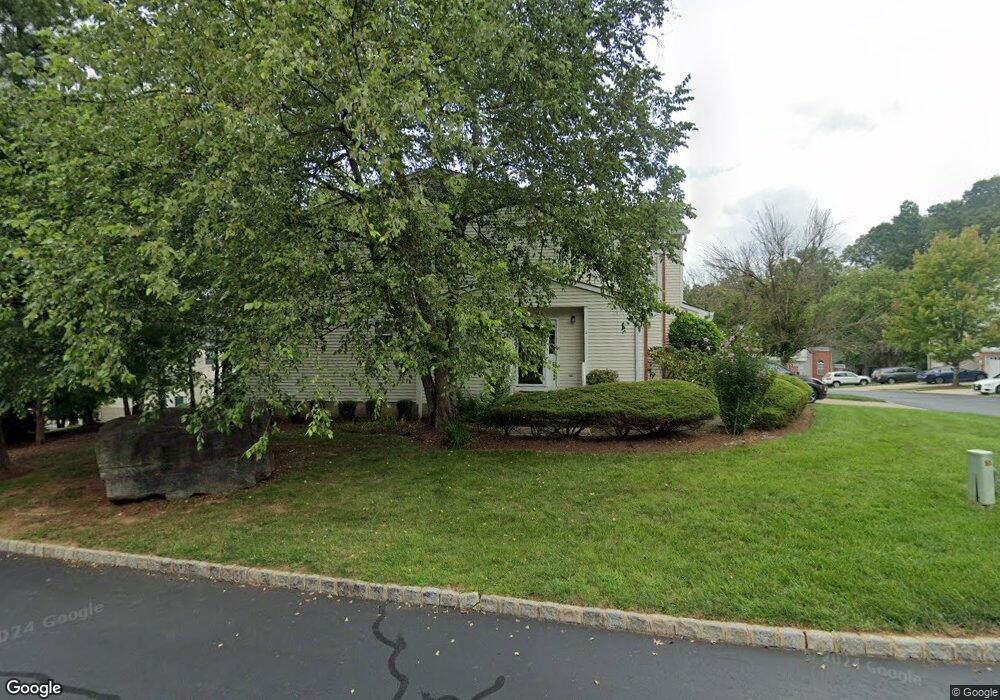
24 Garfield Way Princeton, NJ 08540
Estimated Value: $566,000 - $655,735
3
Beds
3
Baths
1,494
Sq Ft
$409/Sq Ft
Est. Value
About This Home
This home is located at 24 Garfield Way, Princeton, NJ 08540 and is currently estimated at $611,434, approximately $409 per square foot. 24 Garfield Way is a home located in Somerset County with nearby schools including Orchard Hill Elementary School, Montgomery Lower Mid School, and Village Elementary School.
Ownership History
Date
Name
Owned For
Owner Type
Purchase Details
Closed on
May 4, 2013
Sold by
Desai Urvi D and Dadia Urvi D
Bought by
Desai Urvi and Desai Jigar
Current Estimated Value
Home Financials for this Owner
Home Financials are based on the most recent Mortgage that was taken out on this home.
Original Mortgage
$255,750
Outstanding Balance
$53,341
Interest Rate
2.7%
Mortgage Type
New Conventional
Estimated Equity
$558,093
Purchase Details
Closed on
Sep 20, 2007
Sold by
Bomba Evangelina
Bought by
Dadia Urvi D
Home Financials for this Owner
Home Financials are based on the most recent Mortgage that was taken out on this home.
Original Mortgage
$263,550
Interest Rate
6.49%
Mortgage Type
Purchase Money Mortgage
Purchase Details
Closed on
Oct 22, 1999
Sold by
Hill Montgomery
Bought by
Bomba Evangelia
Home Financials for this Owner
Home Financials are based on the most recent Mortgage that was taken out on this home.
Original Mortgage
$149,310
Interest Rate
7.73%
Create a Home Valuation Report for This Property
The Home Valuation Report is an in-depth analysis detailing your home's value as well as a comparison with similar homes in the area
Home Values in the Area
Average Home Value in this Area
Purchase History
| Date | Buyer | Sale Price | Title Company |
|---|---|---|---|
| Desai Urvi | -- | None Available | |
| Dadia Urvi D | $331,570 | Multiple | |
| Bomba Evangelia | $165,900 | -- |
Source: Public Records
Mortgage History
| Date | Status | Borrower | Loan Amount |
|---|---|---|---|
| Open | Desai Urvi | $255,750 | |
| Closed | Dadia Urvi D | $263,550 | |
| Previous Owner | Bomba Evangelia | $149,310 |
Source: Public Records
Tax History Compared to Growth
Tax History
| Year | Tax Paid | Tax Assessment Tax Assessment Total Assessment is a certain percentage of the fair market value that is determined by local assessors to be the total taxable value of land and additions on the property. | Land | Improvement |
|---|---|---|---|---|
| 2025 | $11,326 | $330,400 | $192,900 | $137,500 |
| 2024 | $11,326 | $330,400 | $192,900 | $137,500 |
| 2023 | $11,310 | $330,400 | $192,900 | $137,500 |
| 2022 | $10,649 | $330,400 | $192,900 | $137,500 |
| 2021 | $10,556 | $330,400 | $192,900 | $137,500 |
| 2020 | $10,467 | $330,400 | $192,900 | $137,500 |
| 2019 | $10,394 | $330,400 | $192,900 | $137,500 |
| 2018 | $10,150 | $330,400 | $192,900 | $137,500 |
| 2017 | $9,995 | $330,400 | $192,900 | $137,500 |
| 2016 | $9,819 | $330,400 | $192,900 | $137,500 |
| 2015 | $9,601 | $330,400 | $192,900 | $137,500 |
| 2014 | $9,486 | $330,400 | $192,900 | $137,500 |
Source: Public Records
Map
Nearby Homes
- 23 Taft Ct
- 100 Jackson Ave
- 35 Truman Ave
- 37 Crescent Ave
- 33 Kennedy Ct
- 36 -D Needham Way
- 36 Needham Way Unit D
- 8B Brookline Ct
- 8 -B Brookline Ct Unit B
- 2 Washington St
- 851 Mount Lucas Rd
- 835 Mount Lucas Rd
- 18 Oxford Cir
- 110 Village Dr
- 108 Village Dr
- 112 Village Dr
- 106 Village Dr
- 17 E Hartwick Dr
- 108 Dogwood Hill
- 617 Mount Lucas Rd
- 26 Garfield Way
- 22 Garfield Way
- 28 Garfield Way
- 30 Garfield Way
- 32 Garfield Way
- 34 Garfield Way
- 23 Grant Way
- 25 Grant Way
- 36 Garfield Way
- 27 Grant Way
- 21 Garfield Way
- 19 Garfield Way
- 23 Garfield Way
- 17 Garfield Way
- 25 Garfield Way
- 29 Grant Way
- 15 Garfield Way
- 27 Garfield Way
- 13 Garfield Way
- 31 Grant Way