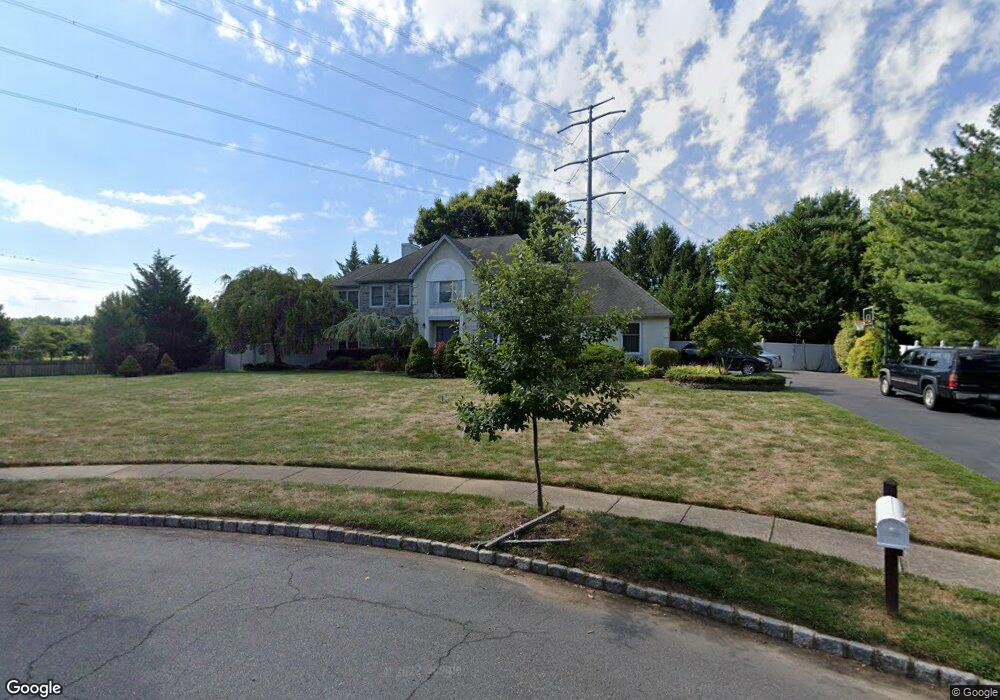
24 Garnet Ln Princeton Junction, NJ 08550
Estimated Value: $1,299,679 - $1,372,000
--
Bed
--
Bath
3,298
Sq Ft
$403/Sq Ft
Est. Value
About This Home
This home is located at 24 Garnet Ln, Princeton Junction, NJ 08550 and is currently estimated at $1,329,920, approximately $403 per square foot. 24 Garnet Ln is a home located in Mercer County with nearby schools including Village Elementary School, Dutch Neck Elementary School, and Community Middle School.
Ownership History
Date
Name
Owned For
Owner Type
Purchase Details
Closed on
Aug 15, 2002
Sold by
Kim Sung
Bought by
Dunn James and Dunn Lisa
Current Estimated Value
Home Financials for this Owner
Home Financials are based on the most recent Mortgage that was taken out on this home.
Original Mortgage
$368,000
Outstanding Balance
$155,942
Interest Rate
6.57%
Mortgage Type
Purchase Money Mortgage
Estimated Equity
$1,173,978
Purchase Details
Closed on
Jun 30, 1999
Sold by
Chan Wing Keung Arthur
Bought by
Kim Sung and Kim Soon
Home Financials for this Owner
Home Financials are based on the most recent Mortgage that was taken out on this home.
Original Mortgage
$284,000
Interest Rate
7.49%
Mortgage Type
Purchase Money Mortgage
Purchase Details
Closed on
Mar 12, 1992
Sold by
Sharbell Development Corp
Bought by
Chan Wing-Keung-Arthur
Purchase Details
Closed on
Jun 1, 1988
Sold by
Hathamar Ltd - Columbia House
Bought by
Sharbell Development Corp
Create a Home Valuation Report for This Property
The Home Valuation Report is an in-depth analysis detailing your home's value as well as a comparison with similar homes in the area
Home Values in the Area
Average Home Value in this Area
Purchase History
| Date | Buyer | Sale Price | Title Company |
|---|---|---|---|
| Dunn James | $488,000 | -- | |
| Kim Sung | $355,000 | -- | |
| Chan Wing-Keung-Arthur | $296,000 | -- | |
| Sharbell Development Corp | $150,000 | -- |
Source: Public Records
Mortgage History
| Date | Status | Borrower | Loan Amount |
|---|---|---|---|
| Open | Dunn James | $368,000 | |
| Previous Owner | Kim Sung | $284,000 |
Source: Public Records
Tax History Compared to Growth
Tax History
| Year | Tax Paid | Tax Assessment Tax Assessment Total Assessment is a certain percentage of the fair market value that is determined by local assessors to be the total taxable value of land and additions on the property. | Land | Improvement |
|---|---|---|---|---|
| 2025 | $19,049 | $621,500 | $184,800 | $436,700 |
| 2024 | $18,253 | $621,500 | $184,800 | $436,700 |
| 2023 | $18,253 | $621,500 | $184,800 | $436,700 |
| 2022 | $17,899 | $621,500 | $184,800 | $436,700 |
| 2021 | $17,750 | $621,500 | $184,800 | $436,700 |
| 2020 | $17,427 | $621,500 | $184,800 | $436,700 |
| 2019 | $17,228 | $621,500 | $184,800 | $436,700 |
| 2018 | $17,066 | $621,500 | $184,800 | $436,700 |
| 2017 | $16,712 | $621,500 | $184,800 | $436,700 |
| 2016 | $16,352 | $621,500 | $184,800 | $436,700 |
| 2015 | $15,973 | $621,500 | $184,800 | $436,700 |
| 2014 | $15,786 | $621,500 | $184,800 | $436,700 |
Source: Public Records
Map
Nearby Homes