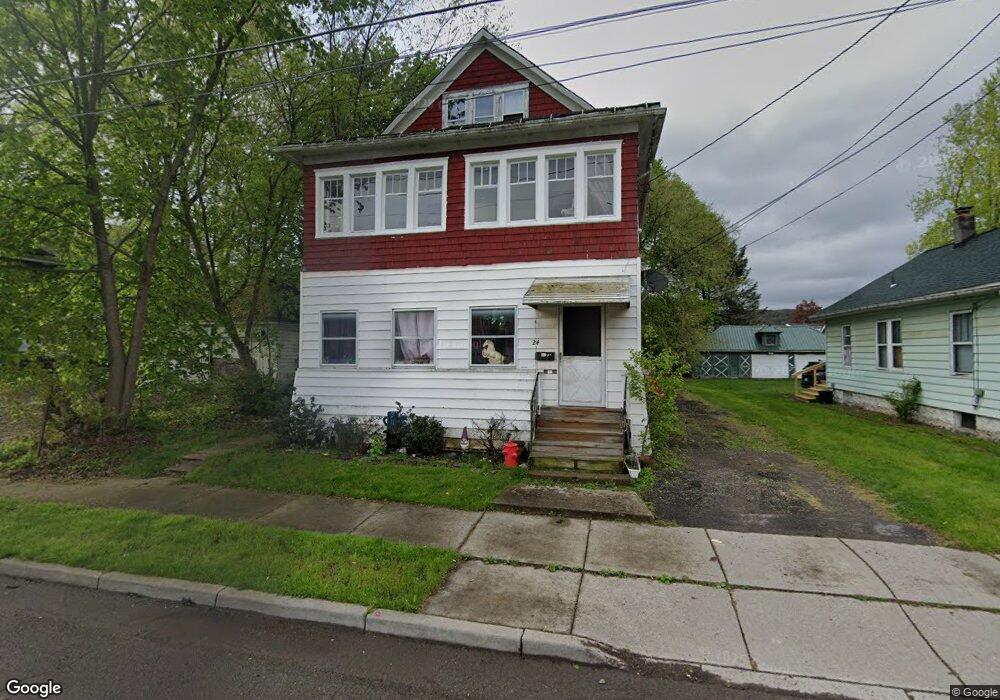
24 George St Binghamton, NY 13904
Eastside Binghamton NeighborhoodEstimated Value: $113,586 - $146,000
4
Beds
2
Baths
2,064
Sq Ft
$60/Sq Ft
Est. Value
About This Home
This home is located at 24 George St, Binghamton, NY 13904 and is currently estimated at $123,147, approximately $59 per square foot. 24 George St is a home located in Broome County with nearby schools including Calvin Coolidge Elementary School, Binghamton High School, and East Middle School.
Ownership History
Date
Name
Owned For
Owner Type
Purchase Details
Closed on
Mar 26, 2025
Sold by
Next Level Mazel Llc
Bought by
43 Clarke Associates Llc
Current Estimated Value
Purchase Details
Closed on
May 20, 2024
Sold by
Mazel Realty Holding Llc
Bought by
Next Level Mazel Llc
Purchase Details
Closed on
Dec 4, 2023
Sold by
Mazel Realty Holding Llc
Bought by
Next Level Mazel Llc
Purchase Details
Closed on
Jan 26, 2017
Sold by
Macuch Harold G
Bought by
Mazel Realty Holding Llc
Purchase Details
Closed on
Dec 12, 2016
Sold by
County Of Broome
Bought by
Macuch Harold G
Purchase Details
Closed on
Aug 24, 2016
Sold by
Hamlin David C
Bought by
County Of Broome
Purchase Details
Closed on
Oct 25, 2002
Sold by
Hodel Jennie Allen
Bought by
Bednar William R
Create a Home Valuation Report for This Property
The Home Valuation Report is an in-depth analysis detailing your home's value as well as a comparison with similar homes in the area
Home Values in the Area
Average Home Value in this Area
Purchase History
| Date | Buyer | Sale Price | Title Company |
|---|---|---|---|
| 43 Clarke Associates Llc | $110,000 | None Listed On Document | |
| 43 Clarke Associates Llc | $110,000 | None Listed On Document | |
| Next Level Mazel Llc | -- | None Listed On Document | |
| Next Level Mazel Llc | -- | None Listed On Document | |
| Mazel Realty Holding Llc | -- | None Available | |
| Macuch Harold G | -- | None Available | |
| County Of Broome | -- | None Available | |
| Bednar William R | $20,000 | -- |
Source: Public Records
Tax History
| Year | Tax Paid | Tax Assessment Tax Assessment Total Assessment is a certain percentage of the fair market value that is determined by local assessors to be the total taxable value of land and additions on the property. | Land | Improvement |
|---|---|---|---|---|
| 2025 | $4,415 | $44,800 | $11,200 | $33,600 |
| 2024 | $4,415 | $44,800 | $11,200 | $33,600 |
| 2023 | $4,335 | $44,800 | $11,200 | $33,600 |
| 2022 | $4,233 | $44,800 | $11,200 | $33,600 |
| 2021 | $4,185 | $44,800 | $11,200 | $33,600 |
| 2020 | $2,768 | $44,800 | $11,200 | $33,600 |
| 2019 | $1,829 | $44,800 | $11,200 | $33,600 |
| 2018 | $3,494 | $58,000 | $11,200 | $46,800 |
| 2017 | $3,512 | $58,000 | $11,200 | $46,800 |
| 2016 | $3,526 | $58,000 | $11,200 | $46,800 |
| 2015 | $3,133 | $58,000 | $11,200 | $46,800 |
| 2014 | $3,133 | $58,000 | $11,200 | $46,800 |
Source: Public Records
Map
Nearby Homes
Your Personal Tour Guide
Ask me questions while you tour the home.