24 Harbor St Newburyport, MA 01950
Estimated Value: $682,000 - $821,000
1
Bed
1
Bath
745
Sq Ft
$1,048/Sq Ft
Est. Value
About This Home
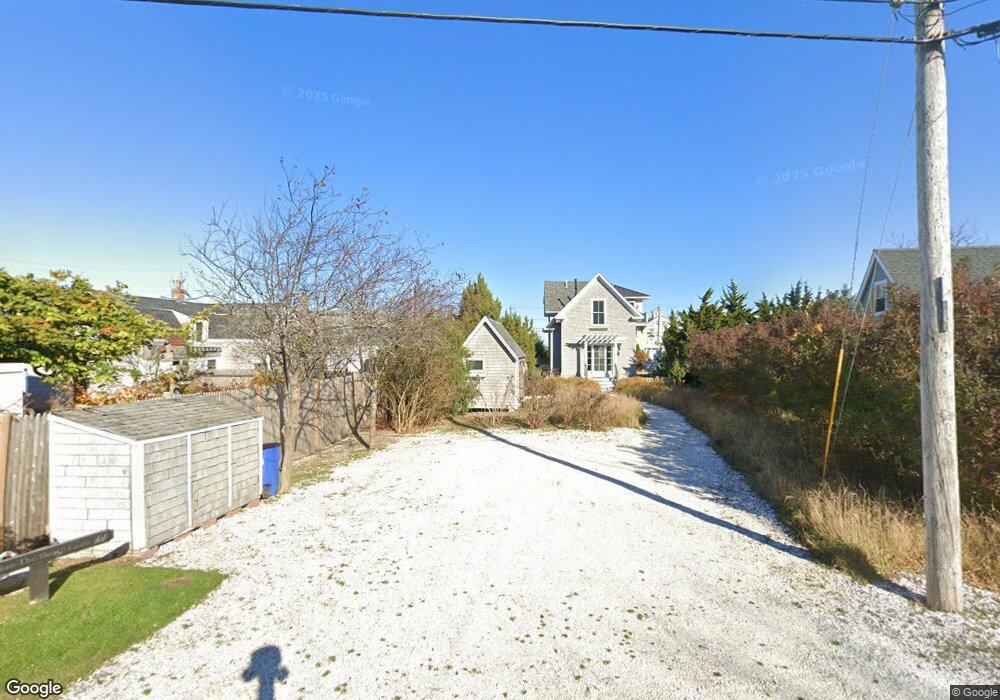
This home is located at 24 Harbor St, Newburyport, MA 01950 and is currently estimated at $780,513, approximately $1,047 per square foot. 24 Harbor St is a home with nearby schools including Francis T. Bresnahan Elementary School, Edward G. Molin Elementary School, and Rupert A. Nock Middle School.
Ownership History
Date
Name
Owned For
Owner Type
Purchase Details
Closed on
May 6, 2020
Sold by
Wilson Tom 2019 Ret
Bought by
Moody Alexander and Moody Kristin
Current Estimated Value
Home Financials for this Owner
Home Financials are based on the most recent Mortgage that was taken out on this home.
Original Mortgage
$427,500
Outstanding Balance
$378,824
Interest Rate
3.3%
Mortgage Type
New Conventional
Estimated Equity
$401,689
Purchase Details
Closed on
Oct 5, 2019
Sold by
Maurer Maryellen and Mazer Richard M
Bought by
Maryellen Maurer 2019 Ret
Purchase Details
Closed on
Jan 26, 2015
Sold by
Raftery Kevin and Raftery Debra
Bought by
Maurer Maryellen and Tom Wilson
Home Financials for this Owner
Home Financials are based on the most recent Mortgage that was taken out on this home.
Original Mortgage
$344,000
Interest Rate
3.96%
Mortgage Type
New Conventional
Purchase Details
Closed on
Oct 9, 1996
Sold by
Burns Virginia C
Bought by
Perry Robert S
Create a Home Valuation Report for This Property
The Home Valuation Report is an in-depth analysis detailing your home's value as well as a comparison with similar homes in the area
Home Values in the Area
Average Home Value in this Area
Purchase History
| Date | Buyer | Sale Price | Title Company |
|---|---|---|---|
| Moody Alexander | $475,000 | None Available | |
| Maryellen Maurer 2019 Ret | -- | -- | |
| Maurer Maryellen | $430,000 | -- | |
| Perry Robert S | $65,000 | -- |
Source: Public Records
Mortgage History
| Date | Status | Borrower | Loan Amount |
|---|---|---|---|
| Open | Moody Alexander | $427,500 | |
| Previous Owner | Maurer Maryellen | $344,000 |
Source: Public Records
Tax History Compared to Growth
Tax History
| Year | Tax Paid | Tax Assessment Tax Assessment Total Assessment is a certain percentage of the fair market value that is determined by local assessors to be the total taxable value of land and additions on the property. | Land | Improvement |
|---|---|---|---|---|
| 2025 | $6,850 | $715,000 | $496,100 | $218,900 |
| 2024 | $6,491 | $651,100 | $451,000 | $200,100 |
| 2023 | $5,993 | $558,000 | $357,900 | $200,100 |
| 2022 | $5,633 | $469,000 | $298,300 | $170,700 |
| 2021 | $5,812 | $459,800 | $294,700 | $165,100 |
| 2020 | $6,130 | $477,400 | $294,700 | $182,700 |
| 2019 | $5,920 | $452,600 | $283,000 | $169,600 |
| 2018 | $5,723 | $431,600 | $269,500 | $162,100 |
| 2017 | $5,593 | $415,800 | $256,700 | $159,100 |
| 2016 | $5,248 | $391,900 | $254,700 | $137,200 |
| 2015 | $920 | $69,000 | $69,000 | $0 |
Source: Public Records
Map
Nearby Homes