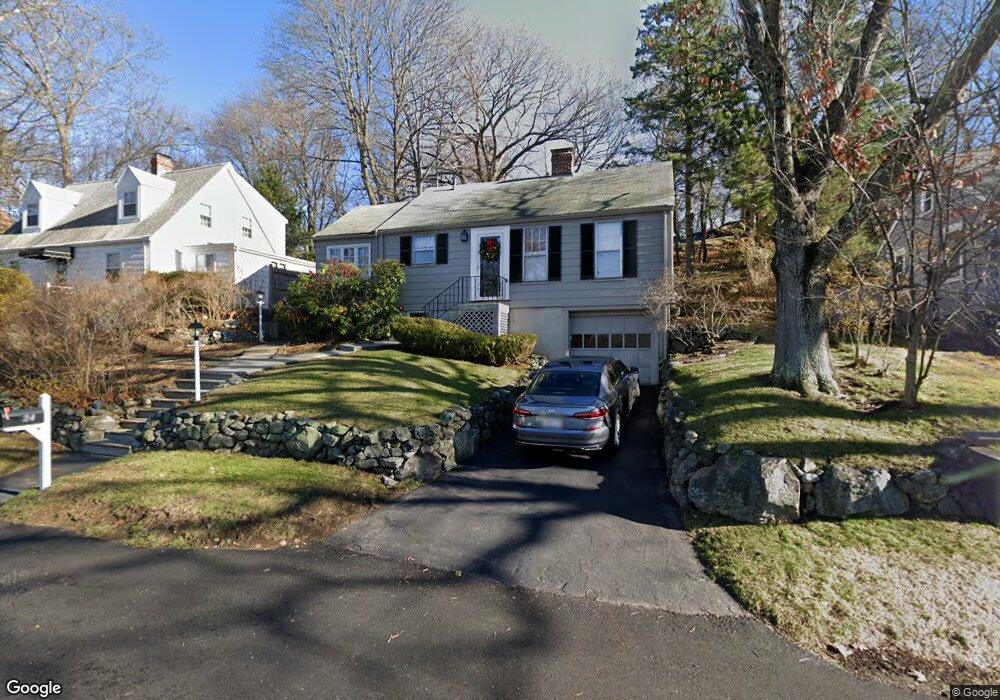
24 Henry St Winchester, MA 01890
West Side NeighborhoodEstimated Value: $737,386 - $917,000
1
Bed
1
Bath
894
Sq Ft
$888/Sq Ft
Est. Value
About This Home
This home is located at 24 Henry St, Winchester, MA 01890 and is currently estimated at $793,597, approximately $887 per square foot. 24 Henry St is a home located in Middlesex County with nearby schools including Vinson-Owen Elementary School, McCall Middle School, and Winchester High School.
Ownership History
Date
Name
Owned For
Owner Type
Purchase Details
Closed on
Nov 8, 2022
Sold by
Miga James W
Bought by
James W Miga Ft
Current Estimated Value
Purchase Details
Closed on
Sep 29, 1995
Sold by
Jackson Ann P
Bought by
Miga James W
Home Financials for this Owner
Home Financials are based on the most recent Mortgage that was taken out on this home.
Original Mortgage
$136,000
Interest Rate
7.89%
Mortgage Type
Purchase Money Mortgage
Create a Home Valuation Report for This Property
The Home Valuation Report is an in-depth analysis detailing your home's value as well as a comparison with similar homes in the area
Home Values in the Area
Average Home Value in this Area
Purchase History
| Date | Buyer | Sale Price | Title Company |
|---|---|---|---|
| James W Miga Ft | -- | None Available | |
| Miga James W | $170,000 | -- |
Source: Public Records
Mortgage History
| Date | Status | Borrower | Loan Amount |
|---|---|---|---|
| Previous Owner | Miga James W | $136,000 |
Source: Public Records
Tax History Compared to Growth
Tax History
| Year | Tax Paid | Tax Assessment Tax Assessment Total Assessment is a certain percentage of the fair market value that is determined by local assessors to be the total taxable value of land and additions on the property. | Land | Improvement |
|---|---|---|---|---|
| 2025 | $79 | $715,000 | $551,300 | $163,700 |
| 2024 | $8,093 | $714,300 | $551,300 | $163,000 |
| 2023 | $7,776 | $659,000 | $505,300 | $153,700 |
| 2022 | $6,684 | $534,300 | $382,800 | $151,500 |
| 2021 | $7,653 | $526,700 | $375,200 | $151,500 |
| 2020 | $6,526 | $526,700 | $375,200 | $151,500 |
| 2019 | $5,636 | $465,400 | $313,900 | $151,500 |
| 2018 | $5,446 | $446,800 | $298,600 | $148,200 |
| 2017 | $5,299 | $431,500 | $283,300 | $148,200 |
| 2016 | $4,923 | $421,500 | $283,300 | $138,200 |
| 2015 | $4,792 | $394,700 | $256,500 | $138,200 |
| 2014 | $4,461 | $352,400 | $222,000 | $130,400 |
Source: Public Records
Map
Nearby Homes