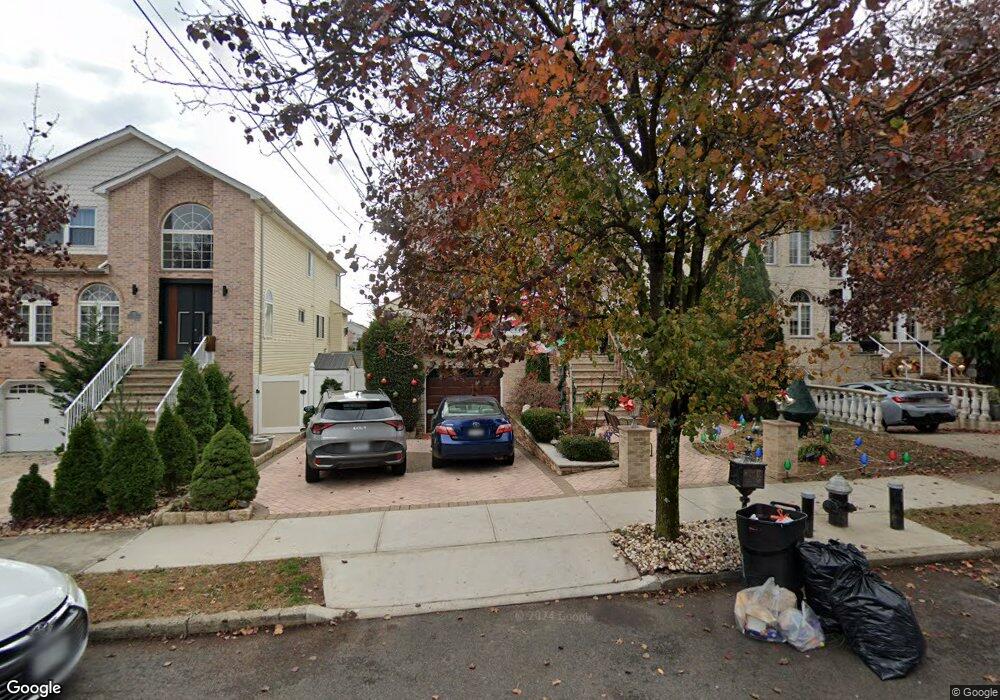
24 Herrick Ave Staten Island, NY 10309
Woodrow NeighborhoodEstimated Value: $1,055,604 - $1,204,000
3
Beds
3
Baths
3,075
Sq Ft
$378/Sq Ft
Est. Value
About This Home
This home is located at 24 Herrick Ave, Staten Island, NY 10309 and is currently estimated at $1,162,151, approximately $377 per square foot. 24 Herrick Ave is a home located in Richmond County with nearby schools including Kathleen Grimm School For Leadership, P.S. 3 - The Margaret Gioiosa School, and Is 34 Tottenville.
Ownership History
Date
Name
Owned For
Owner Type
Purchase Details
Closed on
Jul 10, 2025
Sold by
Cicero-Santalena Giorgio and Cicero-Santalena Josephine
Bought by
Giorgio And Josephine Family Trust and Cicero-Santalena
Current Estimated Value
Purchase Details
Closed on
Jan 14, 2011
Sold by
Pellegrino Saverio
Bought by
Cicero Santalena Giorgio and Cicero Santalena Josephine
Home Financials for this Owner
Home Financials are based on the most recent Mortgage that was taken out on this home.
Original Mortgage
$285,000
Interest Rate
4.82%
Mortgage Type
New Conventional
Purchase Details
Closed on
Jul 21, 2010
Sold by
Pellegrino Peter and Bolusi Rose
Bought by
Pellegrino Saverio
Purchase Details
Closed on
Oct 15, 2008
Sold by
Pellegrino Saverio and Pellegrino Michelina
Bought by
Pellegrino Peter and Bolusi Rose
Purchase Details
Closed on
Feb 22, 2000
Sold by
Englewood Manor Inc
Bought by
Bridle Estates Inc
Create a Home Valuation Report for This Property
The Home Valuation Report is an in-depth analysis detailing your home's value as well as a comparison with similar homes in the area
Home Values in the Area
Average Home Value in this Area
Purchase History
| Date | Buyer | Sale Price | Title Company |
|---|---|---|---|
| Giorgio And Josephine Family Trust | -- | None Listed On Document | |
| Cicero Santalena Giorgio | $650,000 | New Jersey Title Ins Company | |
| Pellegrino Saverio | -- | None Available | |
| Pellegrino Peter | -- | None Available | |
| Bridle Estates Inc | -- | -- |
Source: Public Records
Mortgage History
| Date | Status | Borrower | Loan Amount |
|---|---|---|---|
| Previous Owner | Cicero Santalena Giorgio | $285,000 |
Source: Public Records
Tax History Compared to Growth
Tax History
| Year | Tax Paid | Tax Assessment Tax Assessment Total Assessment is a certain percentage of the fair market value that is determined by local assessors to be the total taxable value of land and additions on the property. | Land | Improvement |
|---|---|---|---|---|
| 2025 | $10,267 | $72,600 | $9,109 | $63,491 |
| 2024 | $10,279 | $63,360 | $9,847 | $53,513 |
| 2023 | $9,778 | $49,546 | $8,568 | $40,978 |
| 2022 | $9,044 | $59,640 | $11,880 | $47,760 |
| 2021 | $9,534 | $52,560 | $11,880 | $40,680 |
| 2020 | $9,524 | $51,120 | $11,880 | $39,240 |
| 2019 | $6,162 | $52,800 | $11,880 | $40,920 |
| 2018 | $8,119 | $41,288 | $10,973 | $30,315 |
| 2017 | $7,641 | $38,952 | $10,465 | $28,487 |
| 2016 | $7,477 | $38,952 | $11,392 | $27,560 |
| 2015 | $6,694 | $38,659 | $9,138 | $29,521 |
| 2014 | $6,694 | $36,471 | $9,330 | $27,141 |
Source: Public Records
Map
Nearby Homes
- 476 Hargold Ave
- 116 Churchill Ave
- 75 Churchill Ave
- 55 Quail Ln
- 105 Churchill Ave
- 50 Mallard Ln
- 117 Pembrook Loop
- 23 Helene Ct
- 19 Woodrose Ln
- 23 Sharon Ln
- 59 Pembrook Loop
- 155 Darnell Ln
- 124 Santa Monica Ln
- 28 Hallister St
- 11 Jessica Ln
- 53 Marisa Cir
- 518 Bradford Ave
- 75 Santa Monica Ln
- 100 Marisa Cir
- 33 White Oak Ln