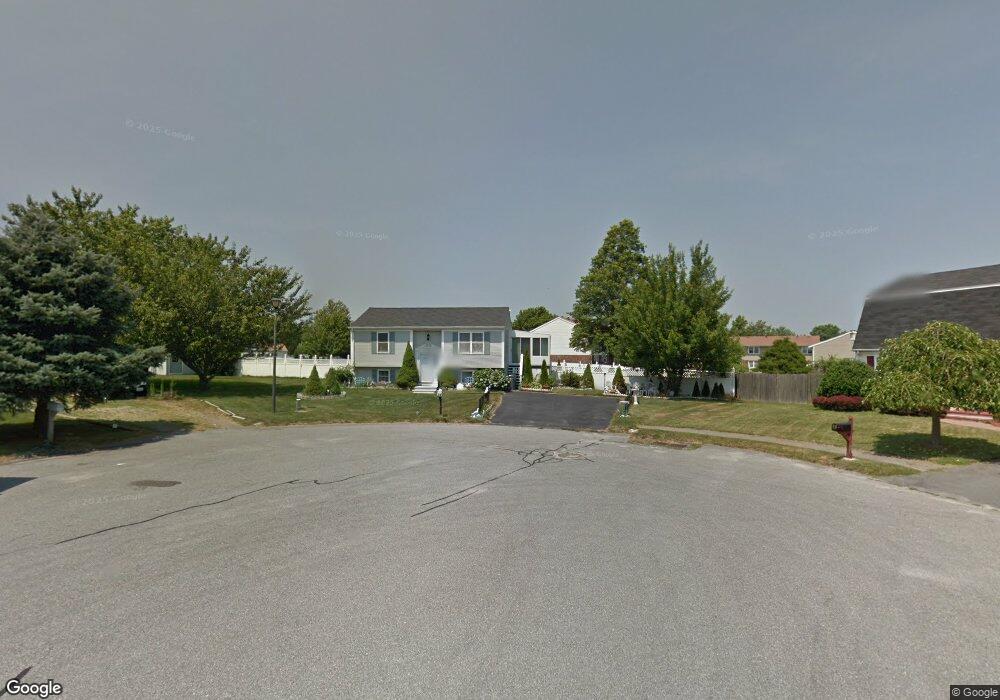
24 High Meadow Ct Middletown, RI 02842
Estimated Value: $482,000 - $657,000
3
Beds
2
Baths
1,441
Sq Ft
$396/Sq Ft
Est. Value
About This Home
This home is located at 24 High Meadow Ct, Middletown, RI 02842 and is currently estimated at $570,918, approximately $396 per square foot. 24 High Meadow Ct is a home located in Newport County with nearby schools including Middletown High School and All Saints STEAM Academy.
Ownership History
Date
Name
Owned For
Owner Type
Purchase Details
Closed on
Dec 19, 2022
Sold by
P C & L P Kubchandani Ft
Bought by
Khubchandani Pushu C and Khubchandani Leelu P
Current Estimated Value
Purchase Details
Closed on
Jul 21, 2015
Sold by
Khubchandani Pushu C
Bought by
Khubchandani Push C and Khubchandani L
Purchase Details
Closed on
Apr 28, 1998
Sold by
Barboza Robert W and Barboza Colleen
Bought by
Khubchandani Pushu C
Purchase Details
Closed on
Oct 15, 1992
Sold by
Wvf Inc
Bought by
Barboza Robert W and Mcgovern Colleen S
Create a Home Valuation Report for This Property
The Home Valuation Report is an in-depth analysis detailing your home's value as well as a comparison with similar homes in the area
Home Values in the Area
Average Home Value in this Area
Purchase History
| Date | Buyer | Sale Price | Title Company |
|---|---|---|---|
| Khubchandani Pushu C | -- | None Available | |
| Khubchandani Push C | -- | -- | |
| Khubchandani Pushu C | $122,000 | -- | |
| Barboza Robert W | $90,000 | -- |
Source: Public Records
Mortgage History
| Date | Status | Borrower | Loan Amount |
|---|---|---|---|
| Previous Owner | Barboza Robert W | $326,000 | |
| Previous Owner | Barboza Robert W | $25,000 |
Source: Public Records
Tax History
| Year | Tax Paid | Tax Assessment Tax Assessment Total Assessment is a certain percentage of the fair market value that is determined by local assessors to be the total taxable value of land and additions on the property. | Land | Improvement |
|---|---|---|---|---|
| 2025 | $6,347 | $538,300 | $327,300 | $211,000 |
| 2024 | $6,061 | $538,300 | $327,300 | $211,000 |
| 2023 | $4,476 | $355,500 | $211,200 | $144,300 |
| 2022 | $4,273 | $355,500 | $211,200 | $144,300 |
| 2021 | $4,273 | $355,500 | $211,200 | $144,300 |
| 2020 | $4,134 | $300,400 | $156,100 | $144,300 |
| 2018 | $4,131 | $300,400 | $156,100 | $144,300 |
| 2016 | $3,840 | $249,000 | $130,900 | $118,100 |
| 2015 | $3,745 | $249,000 | $130,900 | $118,100 |
| 2014 | -- | $241,200 | $119,000 | $122,200 |
| 2013 | $3,789 | $241,200 | $119,000 | $122,200 |
Source: Public Records
Map
Nearby Homes
- 35 Squantum Dr
- 11 Roy Ave
- 4 Phillips Ave
- 11 Barton Ln
- 0 Revolution Way
- 502 Forest Rd
- 163 Revolution Way
- 206 Revolution Way
- 743 Forest Park
- 521 Forest Park
- 836 Forest Park
- 662 Forest Park
- 533 Forest Park
- 175 Revolution Way
- 171 Revolution Way
- 481 Oliphant Ln
- 74 Valley Rd
- 51 Smythe St
- 12 Mariner Way
- 18 Randall Ln
- 18 High Meadow Ct
- 23 High Meadow Ct
- 27 Cows Path Rd
- 17 High Meadow Ct
- 189 W View Rd
- 169 W View Rd
- 201 W View Rd
- 18 Old Farm Way
- 16 Old Farm Way
- 24 Old Farm Way
- 36 Cows Path Rd
- 28 Cows Path Rd
- 18 Cows Path Rd
- 157 W View Rd
- 28 Cows Path
- 8 Cows Path Rd
- 184 W View Rd
- 172 W View Rd
- 196 W View Rd
- 160 W View Rd
Your Personal Tour Guide
Ask me questions while you tour the home.