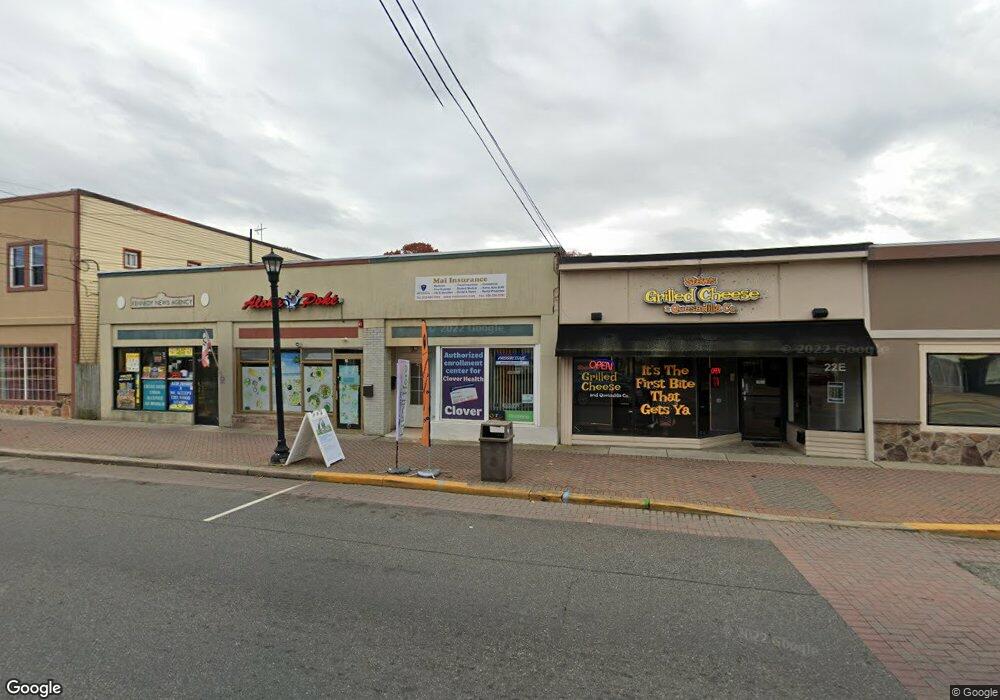
24 High St E Glassboro, NJ 08028
Estimated Value: $138,755
--
Bed
--
Bath
2,250
Sq Ft
$62/Sq Ft
Est. Value
About This Home
This home is located at 24 High St E, Glassboro, NJ 08028 and is currently estimated at $138,755, approximately $61 per square foot. 24 High St E is a home located in Gloucester County with nearby schools including J Harvey Rodgers School, Dorothy L Bullock Elementary, and Glassboro Intermediate School.
Ownership History
Date
Name
Owned For
Owner Type
Purchase Details
Closed on
Sep 15, 2017
Sold by
Kaj Properties Llc
Bought by
Wyf Enterpises Llc
Current Estimated Value
Purchase Details
Closed on
Jan 10, 2011
Sold by
Johnson Marvin L
Bought by
Kaj Properties Llc
Purchase Details
Closed on
Feb 19, 2001
Sold by
Hopkins Audrey
Bought by
Johnson Marvin L
Purchase Details
Closed on
Jul 22, 1999
Sold by
Johnson Marvin L
Bought by
Hopkins Audrey
Home Financials for this Owner
Home Financials are based on the most recent Mortgage that was taken out on this home.
Original Mortgage
$21,000
Interest Rate
7.09%
Mortgage Type
Commercial
Purchase Details
Closed on
Jun 25, 1999
Sold by
Johnson Patricia H and Mick John L
Bought by
Johnson Marvin L
Home Financials for this Owner
Home Financials are based on the most recent Mortgage that was taken out on this home.
Original Mortgage
$21,000
Interest Rate
7.09%
Mortgage Type
Commercial
Create a Home Valuation Report for This Property
The Home Valuation Report is an in-depth analysis detailing your home's value as well as a comparison with similar homes in the area
Home Values in the Area
Average Home Value in this Area
Purchase History
| Date | Buyer | Sale Price | Title Company |
|---|---|---|---|
| Wyf Enterpises Llc | $75,000 | None Available | |
| Kaj Properties Llc | $61,000 | Franklin Title Agency Inc | |
| Johnson Marvin L | -- | -- | |
| Hopkins Audrey | -- | -- | |
| Johnson Marvin L | $27,000 | Pilgrim Title Agency |
Source: Public Records
Mortgage History
| Date | Status | Borrower | Loan Amount |
|---|---|---|---|
| Previous Owner | Johnson Marvin L | $21,000 |
Source: Public Records
Tax History Compared to Growth
Tax History
| Year | Tax Paid | Tax Assessment Tax Assessment Total Assessment is a certain percentage of the fair market value that is determined by local assessors to be the total taxable value of land and additions on the property. | Land | Improvement |
|---|---|---|---|---|
| 2025 | $2,548 | $72,400 | $22,800 | $49,600 |
| 2024 | $2,533 | $72,400 | $22,800 | $49,600 |
| 2023 | $2,533 | $72,400 | $22,800 | $49,600 |
| 2022 | $2,508 | $72,400 | $22,800 | $49,600 |
| 2021 | $2,551 | $72,400 | $22,800 | $49,600 |
| 2020 | $2,565 | $72,400 | $22,800 | $49,600 |
| 2019 | $2,569 | $72,400 | $22,800 | $49,600 |
| 2018 | $2,571 | $72,400 | $22,800 | $49,600 |
| 2017 | $2,583 | $72,400 | $22,800 | $49,600 |
| 2016 | $2,509 | $72,400 | $22,800 | $49,600 |
| 2015 | $2,454 | $72,400 | $22,800 | $49,600 |
| 2014 | $2,399 | $72,400 | $22,800 | $49,600 |
Source: Public Records
Map
Nearby Homes