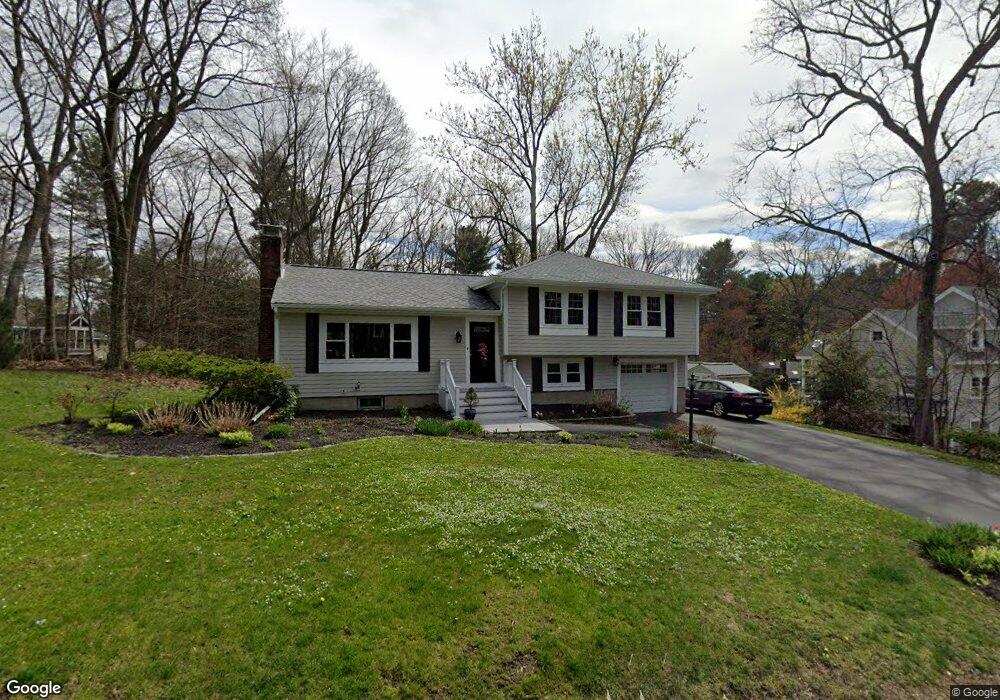
24 Highgate Rd Wayland, MA 01778
Estimated Value: $905,000 - $1,008,000
3
Beds
3
Baths
1,216
Sq Ft
$785/Sq Ft
Est. Value
About This Home
This home is located at 24 Highgate Rd, Wayland, MA 01778 and is currently estimated at $955,140, approximately $785 per square foot. 24 Highgate Rd is a home located in Middlesex County with nearby schools including Wayland High School and Veritas Christian Academy.
Ownership History
Date
Name
Owned For
Owner Type
Purchase Details
Closed on
Jun 2, 2021
Sold by
Nguyen Tri and Ali Sonia
Bought by
Tri Nguyen Ret and Nguyen
Current Estimated Value
Purchase Details
Closed on
Nov 14, 2003
Sold by
Lemaire Kim L
Bought by
Nguyen Tri and Ali Sonia
Purchase Details
Closed on
Dec 18, 1997
Sold by
Lecain Larry and Pfaff-Lecain Laurinda
Bought by
Lemaire Kim L
Create a Home Valuation Report for This Property
The Home Valuation Report is an in-depth analysis detailing your home's value as well as a comparison with similar homes in the area
Home Values in the Area
Average Home Value in this Area
Purchase History
| Date | Buyer | Sale Price | Title Company |
|---|---|---|---|
| Tri Nguyen Ret | -- | None Available | |
| Tri Nguyen Ret | -- | None Available | |
| Nguyen Tri | $468,000 | -- | |
| Nguyen Tri | $468,000 | -- | |
| Lemaire Kim L | $300,000 | -- |
Source: Public Records
Mortgage History
| Date | Status | Borrower | Loan Amount |
|---|---|---|---|
| Previous Owner | Lemaire Kim L | $163,700 | |
| Previous Owner | Lemaire Kim L | $190,000 | |
| Previous Owner | Lemaire Kim L | $200,000 |
Source: Public Records
Tax History
| Year | Tax Paid | Tax Assessment Tax Assessment Total Assessment is a certain percentage of the fair market value that is determined by local assessors to be the total taxable value of land and additions on the property. | Land | Improvement |
|---|---|---|---|---|
| 2025 | $12,945 | $828,200 | $478,400 | $349,800 |
| 2024 | $12,213 | $786,900 | $455,600 | $331,300 |
| 2023 | $11,843 | $711,300 | $414,100 | $297,200 |
| 2022 | $11,309 | $616,300 | $343,000 | $273,300 |
| 2021 | $10,675 | $576,400 | $311,700 | $264,700 |
| 2020 | $10,359 | $583,300 | $311,700 | $271,600 |
| 2019 | $10,100 | $552,500 | $296,900 | $255,600 |
| 2018 | $9,262 | $513,700 | $296,900 | $216,800 |
| 2017 | $8,999 | $496,100 | $282,700 | $213,400 |
| 2016 | $8,465 | $488,200 | $277,100 | $211,100 |
| 2015 | $8,882 | $483,000 | $277,100 | $205,900 |
Source: Public Records
Map
Nearby Homes
- 22 Pine Ridge Rd
- 26 Pine Ridge Rd
- 108 Dudley Rd
- 33 Oak Hill Rd
- 123 Dudley Rd
- 218 Old Connecticut Path
- 1 Cole Rd
- 225 W Plain St
- 37 Davelin Rd
- 226 Stonebridge Rd
- 34 Christopher Ln
- 18 Jay Dr
- 186 Main St
- 45 W Plain St Unit 1
- 26 Jeffrey Rd
- 63 Landham Rd
- 11 Danforth Park Rd
- 87 Landham Rd
- 136 Commonwealth Rd
- 6 Brewster Rd
Your Personal Tour Guide
Ask me questions while you tour the home.