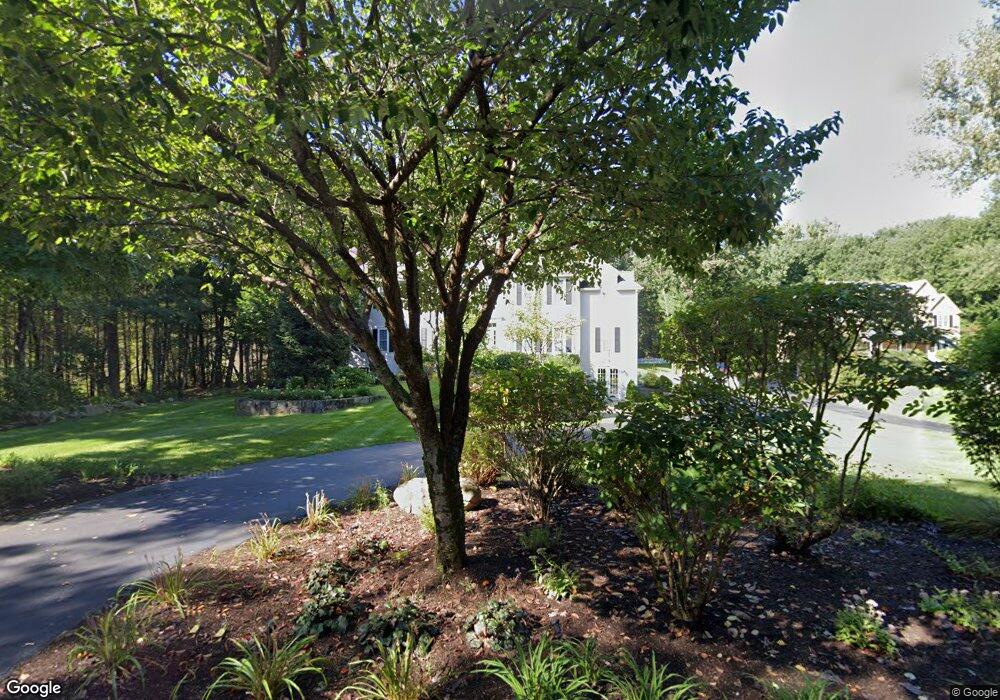
24 Huckleberry Rd Hopkinton, MA 01748
Estimated Value: $1,263,229 - $1,507,000
4
Beds
4
Baths
3,131
Sq Ft
$444/Sq Ft
Est. Value
About This Home
This home is located at 24 Huckleberry Rd, Hopkinton, MA 01748 and is currently estimated at $1,391,557, approximately $444 per square foot. 24 Huckleberry Rd is a home located in Middlesex County with nearby schools including Elmwood Elementary School, Hopkins Elementary School, and Marathon Elementary School.
Ownership History
Date
Name
Owned For
Owner Type
Purchase Details
Closed on
Jul 5, 2018
Sold by
Donahue James P
Bought by
James P Donahue 2018 R
Current Estimated Value
Purchase Details
Closed on
Apr 1, 2011
Sold by
Randall Michael G and Randall Ann E
Bought by
Donahue James P
Home Financials for this Owner
Home Financials are based on the most recent Mortgage that was taken out on this home.
Original Mortgage
$502,988
Interest Rate
5.04%
Mortgage Type
Purchase Money Mortgage
Purchase Details
Closed on
Apr 10, 2006
Sold by
Macnamara Mary and Macnamara Steven
Bought by
Randall Ann E and Randall Michael G
Home Financials for this Owner
Home Financials are based on the most recent Mortgage that was taken out on this home.
Original Mortgage
$60,000
Interest Rate
6.26%
Mortgage Type
Purchase Money Mortgage
Purchase Details
Closed on
Aug 15, 2003
Sold by
Bartolini Bldrs Inc
Bought by
Macnamara Mary and Macnamara Steven
Home Financials for this Owner
Home Financials are based on the most recent Mortgage that was taken out on this home.
Original Mortgage
$79,500
Interest Rate
5.46%
Create a Home Valuation Report for This Property
The Home Valuation Report is an in-depth analysis detailing your home's value as well as a comparison with similar homes in the area
Home Values in the Area
Average Home Value in this Area
Purchase History
| Date | Buyer | Sale Price | Title Company |
|---|---|---|---|
| James P Donahue 2018 R | -- | -- | |
| Donahue James P | $702,500 | -- | |
| Randall Ann E | $765,000 | -- | |
| Macnamara Mary | $800,530 | -- | |
| Bartolini Bldrs Inc | -- | -- |
Source: Public Records
Mortgage History
| Date | Status | Borrower | Loan Amount |
|---|---|---|---|
| Previous Owner | Donahue James P | $502,988 | |
| Previous Owner | Randall Ann E | $60,000 | |
| Previous Owner | Bartolini Bldrs Inc | $79,500 | |
| Previous Owner | Macnamara Mary | $639,960 |
Source: Public Records
Tax History Compared to Growth
Tax History
| Year | Tax Paid | Tax Assessment Tax Assessment Total Assessment is a certain percentage of the fair market value that is determined by local assessors to be the total taxable value of land and additions on the property. | Land | Improvement |
|---|---|---|---|---|
| 2025 | $16,182 | $1,141,200 | $450,100 | $691,100 |
| 2024 | $15,313 | $1,048,100 | $430,000 | $618,100 |
| 2023 | $14,755 | $933,300 | $359,000 | $574,300 |
| 2022 | $14,557 | $854,800 | $329,400 | $525,400 |
| 2021 | $14,163 | $829,200 | $320,700 | $508,500 |
| 2020 | $13,597 | $808,400 | $313,700 | $494,700 |
| 2019 | $13,767 | $801,800 | $308,500 | $493,300 |
| 2018 | $13,091 | $774,600 | $295,400 | $479,200 |
| 2017 | $12,692 | $755,500 | $288,400 | $467,100 |
| 2016 | $12,539 | $736,300 | $282,800 | $453,500 |
| 2015 | $12,558 | $699,200 | $275,400 | $423,800 |
Source: Public Records
Map
Nearby Homes
- 135 Fruit St
- 6 Fruit St
- 24 Greenwood Rd
- 6 Everett Cir
- 60 Wedgewood Dr
- 8 Paul Revere Path Unit 8
- 68 Spring St
- 8 Patriots Blvd
- 9 Highcroft Way Unit 9
- 2 Whisper Way
- 15 Whisper Way
- 17 Whisper Way
- 9 Whisper Way
- 2 Spring Meadow Dr
- 8 Piccadilly Way
- 54 Gilmore Rd
- 3 Candlewood Ln
- 44 Gilmore Rd
- 37 Lincoln St
- 35 Lincoln St
- 22 Huckleberry Rd
- 20 Huckleberry Rd
- 26 Huckleberry Rd
- 21 Huckleberry Rd
- 19 Huckleberry Rd
- 28 Huckleberry Rd
- 23 Huckleberry Rd
- 17 Huckleberry Rd
- 30 Huckleberry Rd
- 25 Huckleberry Rd
- 15 Huckleberry Rd
- 18 Huckleberry Rd
- 27 Huckleberry Rd
- 32 Huckleberry Rd
- 29 Huckleberry Rd
- 16 Huckleberry Rd
- 11 Huckleberry Rd
- 14 Huckleberry Rd
- 34 Huckleberry Rd
- 36 Huckleberry Rd