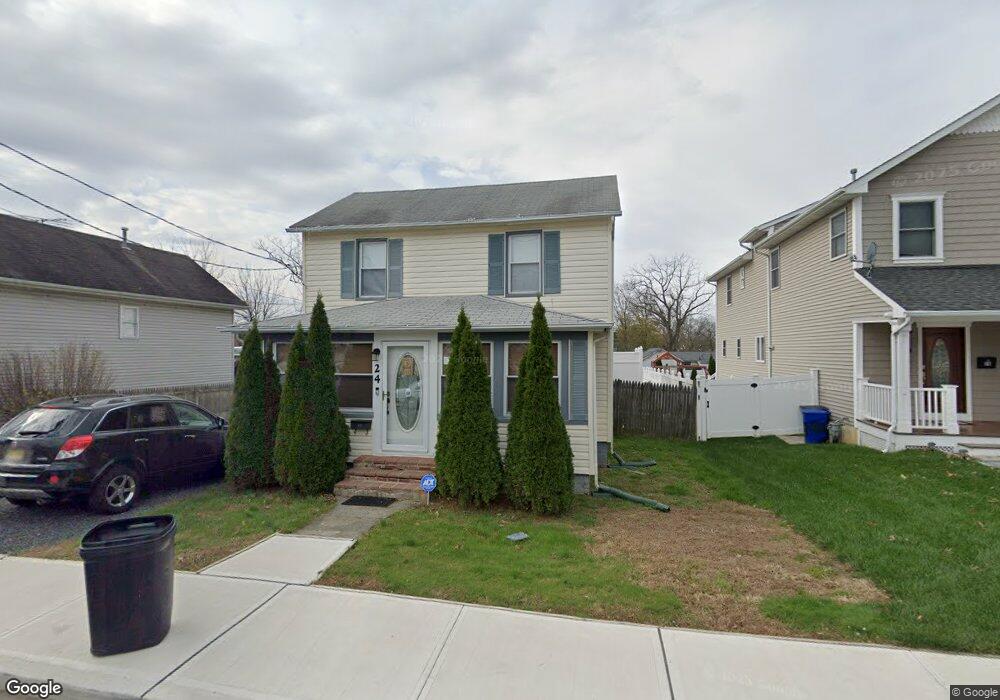
24 Jackson St Long Branch, NJ 07740
Estimated Value: $520,690 - $675,000
4
Beds
1
Bath
1,368
Sq Ft
$430/Sq Ft
Est. Value
About This Home
This home is located at 24 Jackson St, Long Branch, NJ 07740 and is currently estimated at $588,673, approximately $430 per square foot. 24 Jackson St is a home located in Monmouth County with nearby schools including Long Branch High School, Holy Trinity School, and Bet Yaakov of the Jersey Shore.
Ownership History
Date
Name
Owned For
Owner Type
Purchase Details
Closed on
Mar 29, 2005
Sold by
Valerio Dovey L
Bought by
Lelis Marcos and Lelis Sandra
Current Estimated Value
Home Financials for this Owner
Home Financials are based on the most recent Mortgage that was taken out on this home.
Original Mortgage
$312,500
Interest Rate
5.78%
Mortgage Type
FHA
Purchase Details
Closed on
Dec 1, 2003
Sold by
Dennis Wendell
Bought by
Valerio James and Valerio Dovey
Home Financials for this Owner
Home Financials are based on the most recent Mortgage that was taken out on this home.
Original Mortgage
$246,137
Interest Rate
5.82%
Mortgage Type
FHA
Purchase Details
Closed on
Mar 26, 1999
Sold by
Buck Floyd
Bought by
Dennis Wendell and Oprey Terri
Home Financials for this Owner
Home Financials are based on the most recent Mortgage that was taken out on this home.
Original Mortgage
$121,498
Interest Rate
6.95%
Mortgage Type
FHA
Create a Home Valuation Report for This Property
The Home Valuation Report is an in-depth analysis detailing your home's value as well as a comparison with similar homes in the area
Home Values in the Area
Average Home Value in this Area
Purchase History
| Date | Buyer | Sale Price | Title Company |
|---|---|---|---|
| Lelis Marcos | $315,000 | -- | |
| Valerio James | $250,000 | -- | |
| Dennis Wendell | $1,322,500 | -- |
Source: Public Records
Mortgage History
| Date | Status | Borrower | Loan Amount |
|---|---|---|---|
| Previous Owner | Lelis Marcos | $312,500 | |
| Previous Owner | Valerio James | $246,137 | |
| Previous Owner | Dennis Wendell | $121,498 |
Source: Public Records
Tax History
| Year | Tax Paid | Tax Assessment Tax Assessment Total Assessment is a certain percentage of the fair market value that is determined by local assessors to be the total taxable value of land and additions on the property. | Land | Improvement |
|---|---|---|---|---|
| 2025 | $6,119 | $432,800 | $209,200 | $223,600 |
| 2024 | $5,566 | $398,100 | $184,200 | $213,900 |
Source: Public Records
Map
Nearby Homes
- 681 Morford Ave
- 75 Pearl St
- 88 Norwood Ave
- 631 Irving Place
- 28 Morrell St
- 75 Washington St
- 10 Grace Ct
- 657 Campbell Ave
- 554 Winter St
- 7 Linden Ave
- 638 Overton Place
- 395 Broadway
- 940 Broadway
- 25 Community Place
- 38 Hilltop Rd
- 264 Norwood Ave
- 274 Bath Ave
- 274 Bath Ave Unit 23
- 516 Atlantic Ave
- 14 Slocum Place
Your Personal Tour Guide
Ask me questions while you tour the home.