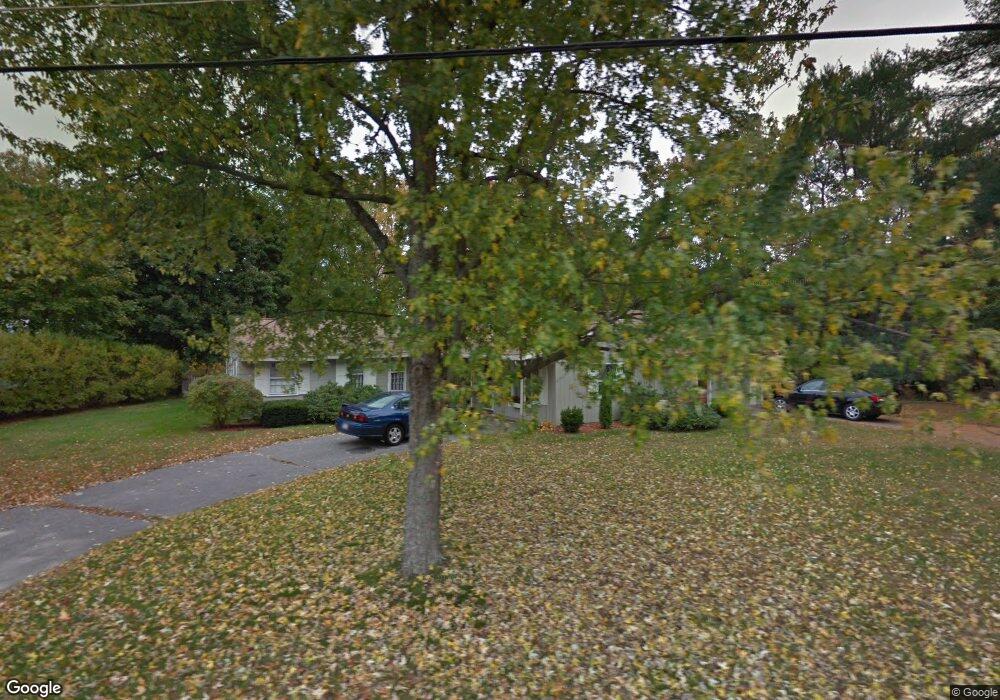
24 Janet Rd Chelmsford, MA 01824
Farms I NeighborhoodEstimated Value: $686,563 - $725,000
3
Beds
3
Baths
1,664
Sq Ft
$420/Sq Ft
Est. Value
About This Home
This home is located at 24 Janet Rd, Chelmsford, MA 01824 and is currently estimated at $698,141, approximately $419 per square foot. 24 Janet Rd is a home located in Middlesex County with nearby schools including South Row Elementary School, McCarthy Middle School, and Knowledge Beginnings South.
Ownership History
Date
Name
Owned For
Owner Type
Purchase Details
Closed on
Feb 26, 2013
Sold by
Moran Charles W and Moran Dianne M
Bought by
Wells Kelly E and Moran Keith P
Current Estimated Value
Home Financials for this Owner
Home Financials are based on the most recent Mortgage that was taken out on this home.
Original Mortgage
$75,000
Outstanding Balance
$33,836
Interest Rate
3.38%
Estimated Equity
$664,305
Purchase Details
Closed on
Feb 2, 1979
Bought by
Wells Kelly E
Create a Home Valuation Report for This Property
The Home Valuation Report is an in-depth analysis detailing your home's value as well as a comparison with similar homes in the area
Home Values in the Area
Average Home Value in this Area
Purchase History
| Date | Buyer | Sale Price | Title Company |
|---|---|---|---|
| Wells Kelly E | -- | -- | |
| Wells Kelly E | -- | -- | |
| Wells Kelly E | -- | -- |
Source: Public Records
Mortgage History
| Date | Status | Borrower | Loan Amount |
|---|---|---|---|
| Open | Wells Kelly E | $75,000 | |
| Previous Owner | Wells Kelly E | $54,000 | |
| Previous Owner | Wells Kelly E | $27,000 |
Source: Public Records
Tax History Compared to Growth
Tax History
| Year | Tax Paid | Tax Assessment Tax Assessment Total Assessment is a certain percentage of the fair market value that is determined by local assessors to be the total taxable value of land and additions on the property. | Land | Improvement |
|---|---|---|---|---|
| 2025 | $7,403 | $532,600 | $286,200 | $246,400 |
| 2024 | $7,183 | $527,400 | $286,200 | $241,200 |
| 2023 | $7,047 | $490,400 | $307,800 | $182,600 |
| 2022 | $6,891 | $437,000 | $264,000 | $173,000 |
| 2021 | $6,257 | $397,500 | $242,200 | $155,300 |
| 2020 | $6,406 | $389,400 | $208,000 | $181,400 |
| 2019 | $6,174 | $377,600 | $206,000 | $171,600 |
| 2018 | $6,340 | $353,000 | $185,500 | $167,500 |
| 2017 | $5,914 | $330,000 | $173,800 | $156,200 |
| 2016 | $5,802 | $321,800 | $177,800 | $144,000 |
| 2015 | $5,683 | $303,900 | $161,600 | $142,300 |
| 2014 | $5,489 | $289,200 | $152,800 | $136,400 |
Source: Public Records
Map
Nearby Homes
- 9 Donna Rd
- 10 Parlee Rd
- 175 Mill Rd
- 6 Sierra Dr
- 13 Westgate Rd
- 216 Rangeway Rd Unit 192
- Map29-14-1 Rangeway Rd
- 11 Simonds Farm Rd
- 81 Bartlett St
- 10 Brook St
- 66 Acton Rd
- 6 Walters St
- 3 Kay's Walk
- 15 Kay's Walk
- 1 Kay's Walk Unit 1
- 1 Kay's Walk
- 13 Kay's Walk
- 15 Kay's Walk Unit 4
- 3 Kay's Walk Unit 3
- 9 Acton Rd Unit 4