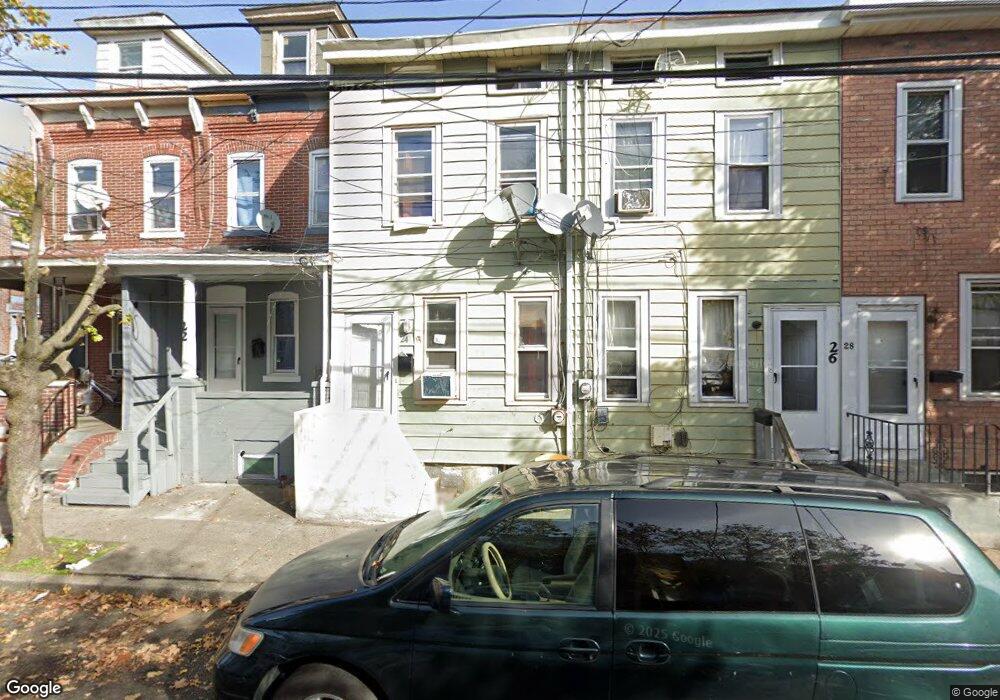
24 Jersey St Trenton, NJ 08611
South Trenton NeighborhoodEstimated Value: $135,985 - $168,000
3
Beds
1
Bath
1,128
Sq Ft
$135/Sq Ft
Est. Value
About This Home
This home is located at 24 Jersey St, Trenton, NJ 08611 and is currently estimated at $152,246, approximately $134 per square foot. 24 Jersey St is a home located in Mercer County with nearby schools including Mott Elementary School, Parker Elementary School, and Dr. Crosby Copeland Elementary School.
Ownership History
Date
Name
Owned For
Owner Type
Purchase Details
Closed on
Sep 9, 2020
Sold by
National Default Real Estate Svcs Llc
Bought by
Say Consulting 18 Llc
Current Estimated Value
Purchase Details
Closed on
Jul 28, 2020
Sold by
Bank Of New York Mellon Trust Company Na
Bought by
National Default Real Estate Svcs Llc
Purchase Details
Closed on
Feb 12, 2020
Sold by
Ransom Jerome
Bought by
Bank Of New York Mellon Trust Company Na and Jpmorgan Chase Bank
Purchase Details
Closed on
Aug 15, 2003
Create a Home Valuation Report for This Property
The Home Valuation Report is an in-depth analysis detailing your home's value as well as a comparison with similar homes in the area
Home Values in the Area
Average Home Value in this Area
Purchase History
| Date | Buyer | Sale Price | Title Company |
|---|---|---|---|
| Say Consulting 18 Llc | $39,000 | Dekel Abstract Llc | |
| National Default Real Estate Svcs Llc | $10,000 | Dekel Abstract | |
| Bank Of New York Mellon Trust Company Na | -- | None Available | |
| -- | $40,000 | -- |
Source: Public Records
Tax History Compared to Growth
Tax History
| Year | Tax Paid | Tax Assessment Tax Assessment Total Assessment is a certain percentage of the fair market value that is determined by local assessors to be the total taxable value of land and additions on the property. | Land | Improvement |
|---|---|---|---|---|
| 2025 | $1,978 | $34,100 | $8,000 | $26,100 |
| 2024 | $1,898 | $34,100 | $8,000 | $26,100 |
| 2023 | $1,898 | $34,100 | $8,000 | $26,100 |
| 2022 | $1,861 | $34,100 | $8,000 | $26,100 |
| 2021 | $1,894 | $34,100 | $8,000 | $26,100 |
| 2020 | $1,887 | $34,100 | $8,000 | $26,100 |
| 2019 | $1,857 | $34,100 | $8,000 | $26,100 |
| 2018 | $1,778 | $34,100 | $8,000 | $26,100 |
| 2017 | $1,690 | $34,100 | $8,000 | $26,100 |
| 2016 | $2,992 | $52,000 | $14,700 | $37,300 |
| 2015 | $2,981 | $52,000 | $14,700 | $37,300 |
| 2014 | $2,967 | $52,000 | $14,700 | $37,300 |
Source: Public Records
Map
Nearby Homes