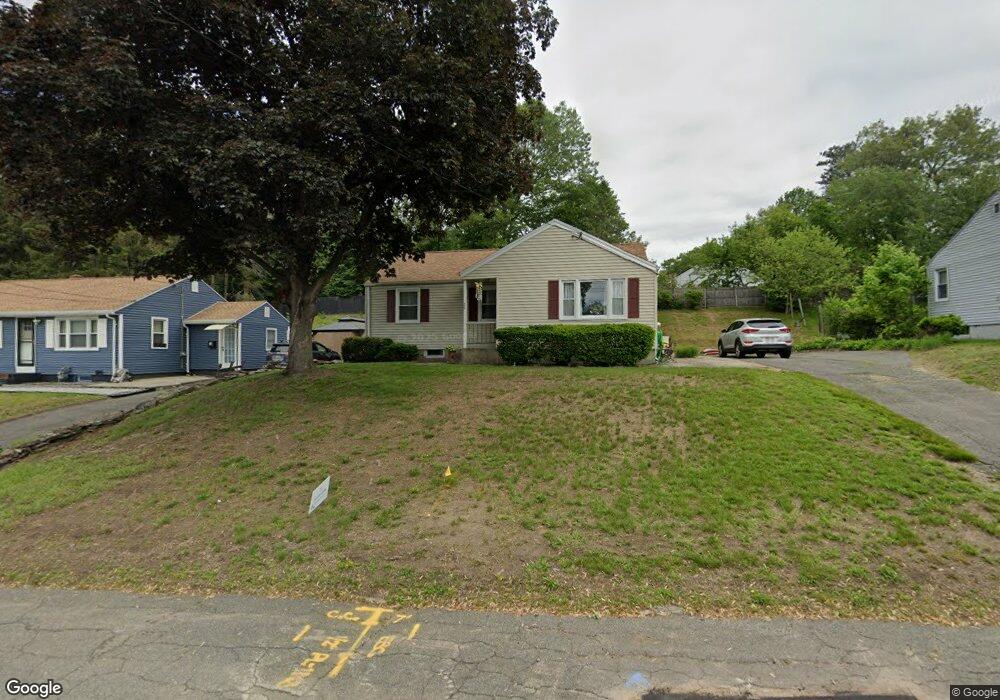
24 Kay St Springfield, MA 01109
Pine Point NeighborhoodEstimated Value: $258,232 - $329,000
3
Beds
1
Bath
966
Sq Ft
$295/Sq Ft
Est. Value
About This Home
This home is located at 24 Kay St, Springfield, MA 01109 and is currently estimated at $285,058, approximately $295 per square foot. 24 Kay St is a home located in Hampden County with nearby schools including Frank H. Freedman School, John J Duggan Middle, and Springfield Central High School.
Ownership History
Date
Name
Owned For
Owner Type
Purchase Details
Closed on
May 22, 2007
Sold by
Simmons Diane M and Simmons William L
Bought by
Simmons Diane M and Simmons Kyle W
Current Estimated Value
Home Financials for this Owner
Home Financials are based on the most recent Mortgage that was taken out on this home.
Original Mortgage
$100,000
Outstanding Balance
$60,860
Interest Rate
6.18%
Mortgage Type
Purchase Money Mortgage
Estimated Equity
$224,198
Create a Home Valuation Report for This Property
The Home Valuation Report is an in-depth analysis detailing your home's value as well as a comparison with similar homes in the area
Home Values in the Area
Average Home Value in this Area
Purchase History
| Date | Buyer | Sale Price | Title Company |
|---|---|---|---|
| Simmons Diane M | -- | -- |
Source: Public Records
Mortgage History
| Date | Status | Borrower | Loan Amount |
|---|---|---|---|
| Open | Simmons Diane M | $100,000 |
Source: Public Records
Tax History
| Year | Tax Paid | Tax Assessment Tax Assessment Total Assessment is a certain percentage of the fair market value that is determined by local assessors to be the total taxable value of land and additions on the property. | Land | Improvement |
|---|---|---|---|---|
| 2025 | $3,359 | $214,200 | $40,800 | $173,400 |
| 2024 | $3,339 | $207,900 | $34,000 | $173,900 |
| 2023 | $2,837 | $166,400 | $30,900 | $135,500 |
| 2022 | $2,448 | $130,100 | $28,900 | $101,200 |
| 2021 | $2,361 | $124,900 | $26,300 | $98,600 |
| 2020 | $2,461 | $126,000 | $26,300 | $99,700 |
| 2019 | $2,373 | $120,600 | $26,300 | $94,300 |
| 2018 | $2,212 | $112,400 | $26,300 | $86,100 |
| 2017 | $2,172 | $110,500 | $24,300 | $86,200 |
| 2016 | $2,062 | $104,900 | $24,300 | $80,600 |
| 2015 | $1,932 | $98,200 | $24,300 | $73,900 |
Source: Public Records
Map
Nearby Homes
Your Personal Tour Guide
Ask me questions while you tour the home.