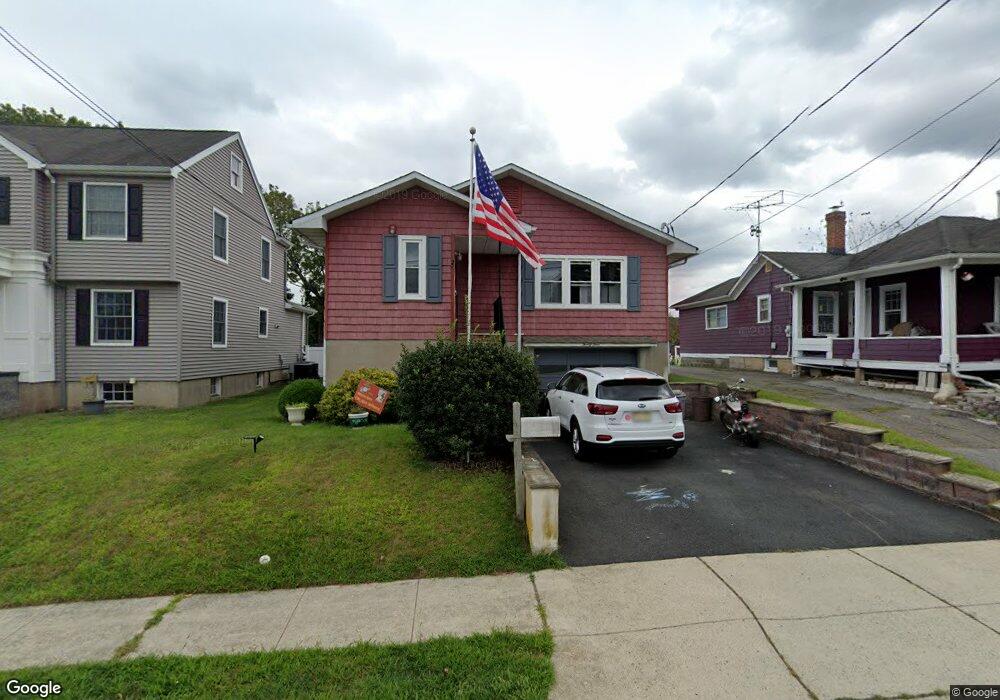
24 Kings Rd Netcong, NJ 07857
Estimated Value: $448,000 - $514,000
Studio
--
Bath
1,752
Sq Ft
$271/Sq Ft
Est. Value
About This Home
This home is located at 24 Kings Rd, Netcong, NJ 07857 and is currently estimated at $474,343, approximately $270 per square foot. 24 Kings Rd is a home located in Morris County with nearby schools including Netcong Elementary School and Lenape Val Regional High School.
Ownership History
Date
Name
Owned For
Owner Type
Purchase Details
Closed on
Jan 12, 2018
Sold by
Gun Theodore F and Gun Joanne M
Bought by
Williams Joshua S and Williams Alexis M
Current Estimated Value
Home Financials for this Owner
Home Financials are based on the most recent Mortgage that was taken out on this home.
Original Mortgage
$245,471
Outstanding Balance
$206,612
Interest Rate
3.93%
Mortgage Type
FHA
Estimated Equity
$267,731
Purchase Details
Closed on
May 16, 2008
Sold by
Ackerman Joanne L
Bought by
Gun Theodore F and Gun Joanne M
Create a Home Valuation Report for This Property
The Home Valuation Report is an in-depth analysis detailing your home's value as well as a comparison with similar homes in the area
Home Values in the Area
Average Home Value in this Area
Purchase History
| Date | Buyer | Sale Price | Title Company |
|---|---|---|---|
| Williams Joshua S | $250,000 | Foundation Title Llc | |
| Gun Theodore F | $275,000 | Colonial Title & Abstract Se |
Source: Public Records
Mortgage History
| Date | Status | Borrower | Loan Amount |
|---|---|---|---|
| Open | Williams Joshua S | $245,471 |
Source: Public Records
Tax History
| Year | Tax Paid | Tax Assessment Tax Assessment Total Assessment is a certain percentage of the fair market value that is determined by local assessors to be the total taxable value of land and additions on the property. | Land | Improvement |
|---|---|---|---|---|
| 2025 | $9,926 | $290,500 | $107,000 | $183,500 |
| 2024 | $10,014 | $290,500 | $107,000 | $183,500 |
| 2023 | $10,014 | $290,500 | $107,000 | $183,500 |
| 2022 | $9,072 | $290,500 | $107,000 | $183,500 |
| 2021 | $9,072 | $290,500 | $107,000 | $183,500 |
| 2020 | $9,062 | $294,600 | $154,300 | $140,300 |
| 2019 | $8,626 | $294,600 | $154,300 | $140,300 |
| 2018 | $8,110 | $294,600 | $154,300 | $140,300 |
| 2017 | $7,792 | $294,600 | $154,300 | $140,300 |
| 2016 | $7,580 | $294,600 | $154,300 | $140,300 |
| 2015 | $7,303 | $294,600 | $154,300 | $140,300 |
| 2014 | $6,985 | $294,600 | $154,300 | $140,300 |
Source: Public Records
Map
Nearby Homes
- 17 Hillside Ave
- 35 Hillside Ave
- 0 Lawrence Ave
- 7 Walton Place
- 8 Silas Rd
- 8 Hillside Ave
- 2 Roberts Place
- 9 Old Traveled Way
- 14 Hill Rd
- 0 Swayze Pl Lawrence Ave
- 79 Main St
- 74 Main St
- 16-18 King St
- 1 Smith St
- 413 Wills Ave
- 8 Spencer St
- 37 Fox Chase Ln
- 4 Woods Ave
- 579 Dell Place Unit 79
- 573 Dell Place Unit 73
Your Personal Tour Guide
Ask me questions while you tour the home.