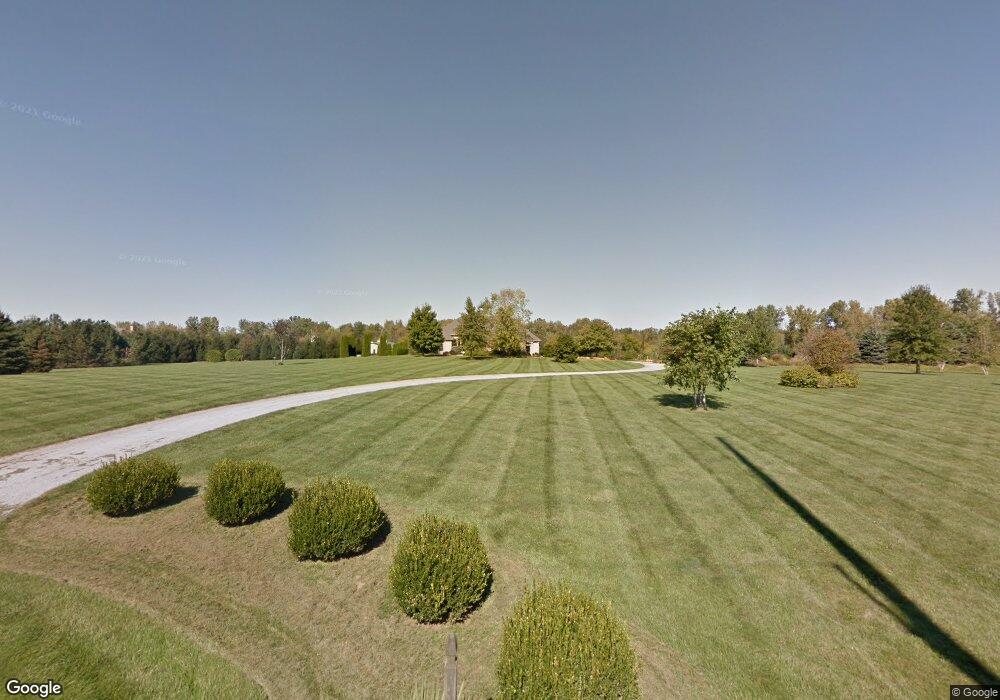
24 Laird Rd Fremont, OH 43420
Estimated Value: $598,000 - $1,994,107
3
Beds
3
Baths
2,413
Sq Ft
$421/Sq Ft
Est. Value
About This Home
This home is located at 24 Laird Rd, Fremont, OH 43420 and is currently estimated at $1,016,027, approximately $421 per square foot. 24 Laird Rd is a home located in Sandusky County with nearby schools including Fremont Ross High School and Bishop Hoffman Catholic School - This is St Joe's School now.
Ownership History
Date
Name
Owned For
Owner Type
Purchase Details
Closed on
Sep 11, 2024
Sold by
Pry James S and Pry Julie A
Bought by
Guardiola David and Guardiola Judy A
Current Estimated Value
Home Financials for this Owner
Home Financials are based on the most recent Mortgage that was taken out on this home.
Original Mortgage
$440,000
Outstanding Balance
$435,293
Interest Rate
6.73%
Mortgage Type
Credit Line Revolving
Estimated Equity
$580,734
Purchase Details
Closed on
Aug 31, 2020
Sold by
Watts Willie H and Watts Diane J
Bought by
Pry James Scott and Pry Julie Ann
Home Financials for this Owner
Home Financials are based on the most recent Mortgage that was taken out on this home.
Original Mortgage
$351,000
Interest Rate
3%
Mortgage Type
New Conventional
Purchase Details
Closed on
Jul 17, 1995
Sold by
Laird Mary K
Bought by
Watts Willie H and Watts Diane J
Create a Home Valuation Report for This Property
The Home Valuation Report is an in-depth analysis detailing your home's value as well as a comparison with similar homes in the area
Home Values in the Area
Average Home Value in this Area
Purchase History
| Date | Buyer | Sale Price | Title Company |
|---|---|---|---|
| Guardiola David | $640,000 | None Listed On Document | |
| Pry James Scott | $439,000 | First American Title | |
| Watts Willie H | $52,000 | -- |
Source: Public Records
Mortgage History
| Date | Status | Borrower | Loan Amount |
|---|---|---|---|
| Open | Guardiola David | $440,000 | |
| Previous Owner | Pry James Scott | $351,000 |
Source: Public Records
Tax History Compared to Growth
Tax History
| Year | Tax Paid | Tax Assessment Tax Assessment Total Assessment is a certain percentage of the fair market value that is determined by local assessors to be the total taxable value of land and additions on the property. | Land | Improvement |
|---|---|---|---|---|
| 2024 | $6,806 | $173,780 | $44,800 | $128,980 |
| 2023 | $6,806 | $141,300 | $36,440 | $104,860 |
| 2022 | $5,910 | $141,300 | $36,440 | $104,860 |
| 2021 | $6,088 | $141,300 | $36,440 | $104,860 |
| 2020 | $5,272 | $128,630 | $32,480 | $96,150 |
| 2019 | $5,266 | $128,630 | $32,480 | $96,150 |
| 2018 | $5,126 | $128,630 | $32,480 | $96,150 |
| 2017 | $4,883 | $122,330 | $32,480 | $89,850 |
| 2016 | $4,285 | $122,330 | $32,480 | $89,850 |
| 2015 | $4,217 | $122,330 | $32,480 | $89,850 |
| 2014 | $4,378 | $121,980 | $32,340 | $89,640 |
| 2013 | $4,286 | $121,980 | $32,340 | $89,640 |
Source: Public Records
Map
Nearby Homes
- 2484 Buckland Ave
- 43 Sun Valley Dr Unit 43
- 822 Upton Rd
- 2020 Elm Dr
- 1719 Buckland Ave
- 10 Meadowbrook Dr
- 10 Meadowbrook Ln
- 1485 Autumn Woods Dr
- 64 River Run Dr Unit J
- 64 River Run Dr
- 880 Cleveland Ave
- 41 Brookview Dr
- 614 3rd Ave
- 135 Briarwood Cir
- 350 Conner Dr
- 1818 Finley Dr
- 1013 Whittlesey St
- 905 Twinn St
- 1970 Morrison Rd
- 1028 June St