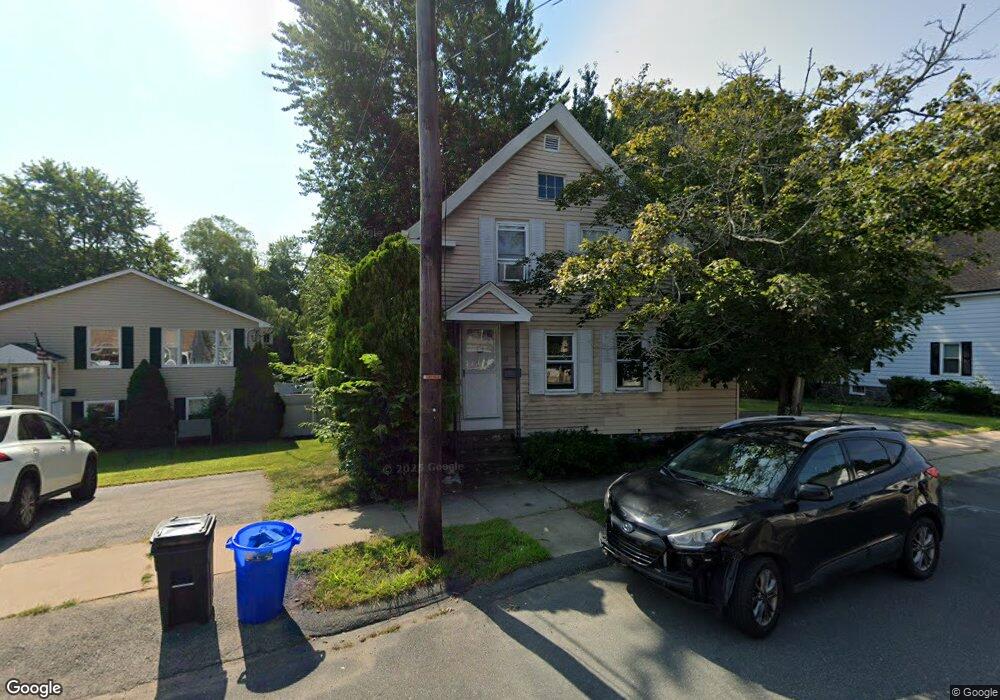
24 Lynn St Peabody, MA 01960
South Peabody NeighborhoodEstimated Value: $520,666 - $542,000
2
Beds
2
Baths
1,242
Sq Ft
$427/Sq Ft
Est. Value
About This Home
This home is located at 24 Lynn St, Peabody, MA 01960 and is currently estimated at $530,167, approximately $426 per square foot. 24 Lynn St is a home located in Essex County with nearby schools including Peabody Veterans Memorial High School, St John The Baptist School, and The Phoenix School.
Ownership History
Date
Name
Owned For
Owner Type
Purchase Details
Closed on
May 6, 2025
Sold by
Lynch John N
Bought by
John N Lynch T N and John Lynch
Current Estimated Value
Purchase Details
Closed on
Dec 28, 2011
Sold by
24 Lynn Street Peabody and 24 Lynch
Bought by
Lynch John N
Home Financials for this Owner
Home Financials are based on the most recent Mortgage that was taken out on this home.
Original Mortgage
$80,000
Interest Rate
4%
Mortgage Type
Purchase Money Mortgage
Create a Home Valuation Report for This Property
The Home Valuation Report is an in-depth analysis detailing your home's value as well as a comparison with similar homes in the area
Home Values in the Area
Average Home Value in this Area
Purchase History
| Date | Buyer | Sale Price | Title Company |
|---|---|---|---|
| John N Lynch T N | -- | None Available | |
| John N Lynch T N | -- | None Available | |
| John N Lynch T N | -- | None Available | |
| Lynch John N | $160,000 | -- | |
| Lynch John N | $160,000 | -- |
Source: Public Records
Mortgage History
| Date | Status | Borrower | Loan Amount |
|---|---|---|---|
| Previous Owner | Lynch John N | $80,000 |
Source: Public Records
Tax History
| Year | Tax Paid | Tax Assessment Tax Assessment Total Assessment is a certain percentage of the fair market value that is determined by local assessors to be the total taxable value of land and additions on the property. | Land | Improvement |
|---|---|---|---|---|
| 2025 | $3,511 | $379,200 | $214,100 | $165,100 |
| 2024 | $3,279 | $359,500 | $214,100 | $145,400 |
| 2023 | $3,489 | $366,500 | $191,200 | $175,300 |
| 2022 | $3,328 | $329,500 | $170,700 | $158,800 |
| 2021 | $3,318 | $316,300 | $155,200 | $161,100 |
| 2020 | $3,227 | $300,500 | $155,200 | $145,300 |
| 2019 | $2,816 | $255,800 | $155,200 | $100,600 |
| 2018 | $2,769 | $241,600 | $141,100 | $100,500 |
| 2017 | $2,741 | $233,100 | $141,100 | $92,000 |
| 2016 | $2,481 | $208,100 | $141,100 | $67,000 |
| 2015 | $2,488 | $202,300 | $137,600 | $64,700 |
Source: Public Records
Map
Nearby Homes
- 3 Margaret Rd
- 6 Allen Rd
- 15 Swampscott Ave
- 18 1/2 Dalton Ct Unit 18 1/2
- 111 Foster St Unit 416
- 98 Foster St
- 80 Foster St Unit 501
- 80 Foster St Unit 507
- 6 Rear Perkins St
- 38 Longview Way
- 38-1/2 Ellsworth Rd
- 64 Foster St Unit 403
- 176 Marlborough Rd
- 26 Bartholomew Terrace
- 12 Tara Rd
- 4R Forest St
- 10 Crowninshield St Unit 303
- 8 Crowninshield St Unit 410
- 158 Lowell St Unit 4
- 2 Osborne St
Your Personal Tour Guide
Ask me questions while you tour the home.