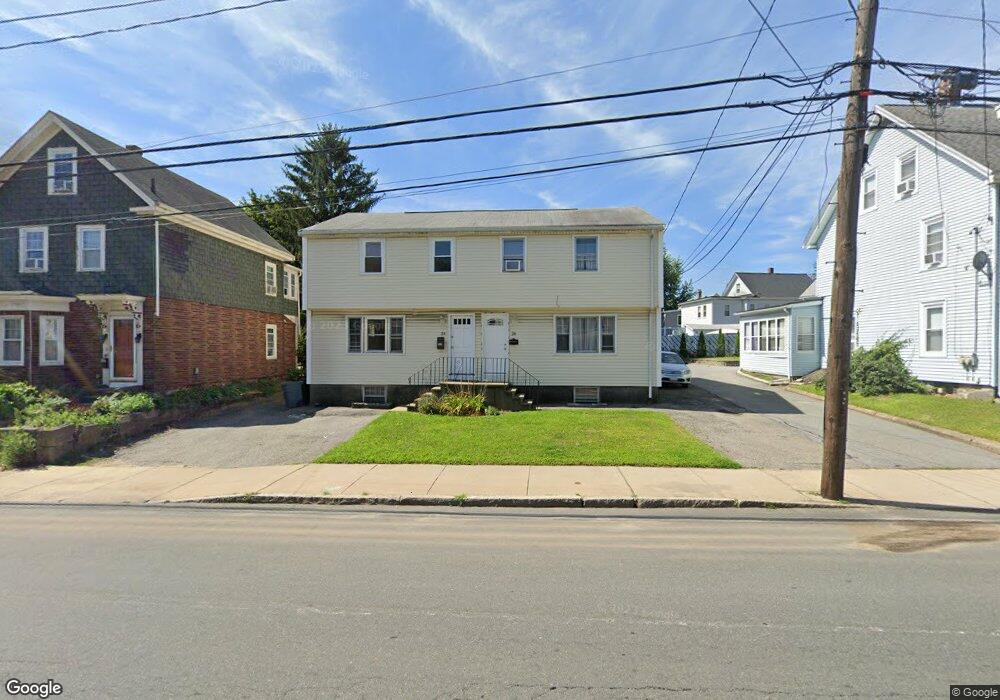
24 Main St Woburn, MA 01801
Downtown Woburn NeighborhoodEstimated Value: $736,223 - $783,000
6
Beds
2
Baths
2,080
Sq Ft
$365/Sq Ft
Est. Value
About This Home
This home is located at 24 Main St, Woburn, MA 01801 and is currently estimated at $758,556, approximately $364 per square foot. 24 Main St is a home located in Middlesex County with nearby schools including Goodyear Elementary School, Daniel L. Joyce Middle School, and Woburn High School.
Ownership History
Date
Name
Owned For
Owner Type
Purchase Details
Closed on
Sep 1, 2016
Sold by
Albert D & Alma Russo Rt
Bought by
Kierce Christopher D and Kierce Amanda D
Current Estimated Value
Home Financials for this Owner
Home Financials are based on the most recent Mortgage that was taken out on this home.
Original Mortgage
$304,500
Outstanding Balance
$243,379
Interest Rate
3.45%
Mortgage Type
New Conventional
Estimated Equity
$515,177
Create a Home Valuation Report for This Property
The Home Valuation Report is an in-depth analysis detailing your home's value as well as a comparison with similar homes in the area
Home Values in the Area
Average Home Value in this Area
Purchase History
| Date | Buyer | Sale Price | Title Company |
|---|---|---|---|
| Kierce Christopher D | $435,000 | -- |
Source: Public Records
Mortgage History
| Date | Status | Borrower | Loan Amount |
|---|---|---|---|
| Open | Kierce Christopher D | $304,500 |
Source: Public Records
Tax History
| Year | Tax Paid | Tax Assessment Tax Assessment Total Assessment is a certain percentage of the fair market value that is determined by local assessors to be the total taxable value of land and additions on the property. | Land | Improvement |
|---|---|---|---|---|
| 2025 | $5,352 | $626,700 | $260,000 | $366,700 |
| 2024 | $4,875 | $604,800 | $247,600 | $357,200 |
| 2023 | $4,976 | $571,900 | $225,100 | $346,800 |
| 2022 | $4,888 | $523,300 | $195,700 | $327,600 |
| 2021 | $4,796 | $514,000 | $186,400 | $327,600 |
| 2020 | $4,342 | $465,900 | $186,400 | $279,500 |
| 2019 | $4,085 | $430,000 | $177,500 | $252,500 |
| 2018 | $4,107 | $415,300 | $162,900 | $252,400 |
| 2017 | $3,560 | $358,100 | $155,100 | $203,000 |
| 2016 | $3,358 | $334,100 | $145,000 | $189,100 |
| 2015 | $3,301 | $324,600 | $135,500 | $189,100 |
| 2014 | $3,329 | $318,900 | $135,500 | $183,400 |
Source: Public Records
Map
Nearby Homes
- 8 Russell Rd Unit 10
- 149 Horn Pond Brook Rd
- 9 Charles Rd
- 6 Porter St
- 20 Arthur St
- 237 Swanton St
- 62 Richardson St
- 0 Mount Pleasant St
- 76 Woodside Rd
- 171 Swanton St Unit 73
- 7 Conant Rd Unit 33
- 6 Highland St
- 15 Sturgis St
- 200 Swanton St Unit 228
- 200 Swanton St Unit 636
- 200 Swanton St Unit T28
- 27 Arlington Rd Unit 2
- 31 Arlington Rd Unit 1-6
- 39 Jefferson Ave
- 7 Prospect St
Your Personal Tour Guide
Ask me questions while you tour the home.