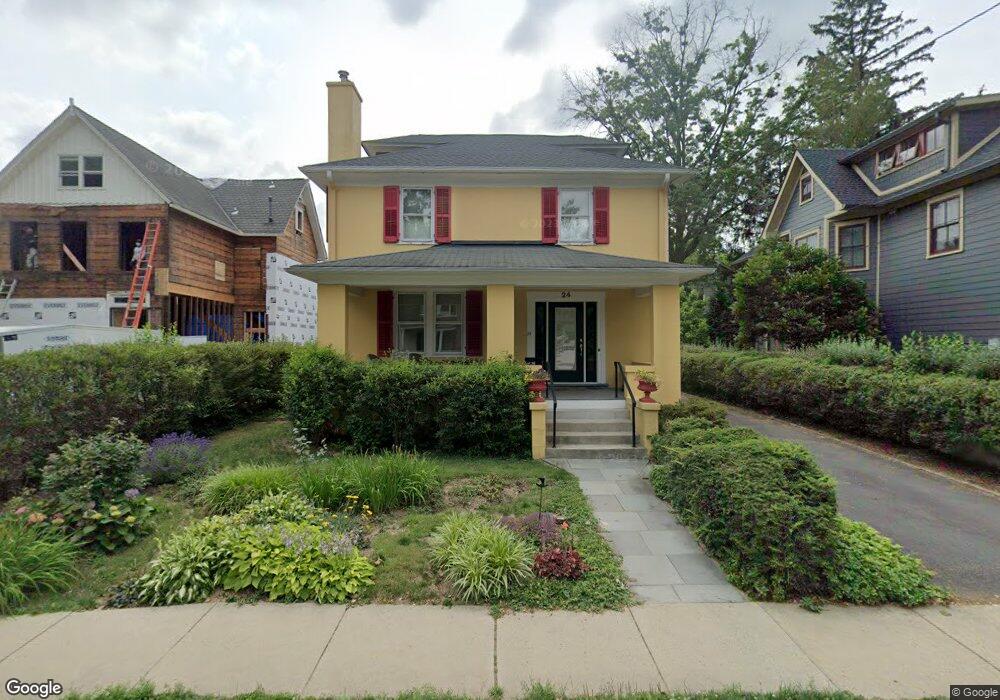
24 Maple St Princeton, NJ 08542
Estimated Value: $1,018,000 - $1,699,000
Studio
--
Bath
1,920
Sq Ft
$699/Sq Ft
Est. Value
About This Home
This home is located at 24 Maple St, Princeton, NJ 08542 and is currently estimated at $1,341,463, approximately $698 per square foot. 24 Maple St is a home located in Mercer County with nearby schools including Community Park Elementary School, Princeton Middle School, and Princeton High School.
Ownership History
Date
Name
Owned For
Owner Type
Purchase Details
Closed on
May 14, 1999
Sold by
Holzman Edgardo
Bought by
Bellos David and Voilley Pascale
Current Estimated Value
Home Financials for this Owner
Home Financials are based on the most recent Mortgage that was taken out on this home.
Original Mortgage
$220,000
Outstanding Balance
$56,279
Interest Rate
6.92%
Estimated Equity
$1,285,184
Purchase Details
Closed on
Jun 28, 1994
Sold by
Lord Graham
Bought by
Holzman Edgardo and Holzman Daphne
Create a Home Valuation Report for This Property
The Home Valuation Report is an in-depth analysis detailing your home's value as well as a comparison with similar homes in the area
Home Values in the Area
Average Home Value in this Area
Purchase History
| Date | Buyer | Sale Price | Title Company |
|---|---|---|---|
| Bellos David | $392,000 | -- | |
| Holzman Edgardo | $375,000 | -- |
Source: Public Records
Mortgage History
| Date | Status | Borrower | Loan Amount |
|---|---|---|---|
| Open | Bellos David | $220,000 |
Source: Public Records
Tax History
| Year | Tax Paid | Tax Assessment Tax Assessment Total Assessment is a certain percentage of the fair market value that is determined by local assessors to be the total taxable value of land and additions on the property. | Land | Improvement |
|---|---|---|---|---|
| 2025 | $23,309 | $875,300 | $511,000 | $364,300 |
| 2024 | $22,005 | $875,300 | $511,000 | $364,300 |
| 2023 | $22,005 | $875,300 | $511,000 | $364,300 |
| 2022 | $21,287 | $875,300 | $511,000 | $364,300 |
| 2021 | $21,144 | $866,900 | $511,000 | $355,900 |
| 2020 | $20,979 | $866,900 | $511,000 | $355,900 |
| 2019 | $20,563 | $866,900 | $511,000 | $355,900 |
| 2018 | $20,216 | $866,900 | $511,000 | $355,900 |
| 2017 | $19,746 | $858,500 | $511,000 | $347,500 |
| 2016 | $16,715 | $738,300 | $476,000 | $262,300 |
| 2015 | $16,331 | $738,300 | $476,000 | $262,300 |
| 2014 | $16,132 | $738,300 | $476,000 | $262,300 |
Source: Public Records
Map
Nearby Homes
- 15 Chestnut St
- 57 Moran Ave
- 17 Aiken Ave
- 44 Park Place Unit 1
- 35 Richard Ct
- 12 Cameron Ct
- 32 Gordon Way Unit 2
- 33 Jefferson Rd
- 1 Markham Rd Unit 1D
- 7 Gordon Way
- 62 Bainbridge St
- 391 Nassau St Unit 2
- 722 Avery Ln
- 721 Avery Ln
- 300 Western Way
- 380 Franklin Ave
- 132 Victoria Mews
- 26 Paul Robeson Place
- 20 Paul Robeson Place
- 22 Paul Robeson Place
Your Personal Tour Guide
Ask me questions while you tour the home.