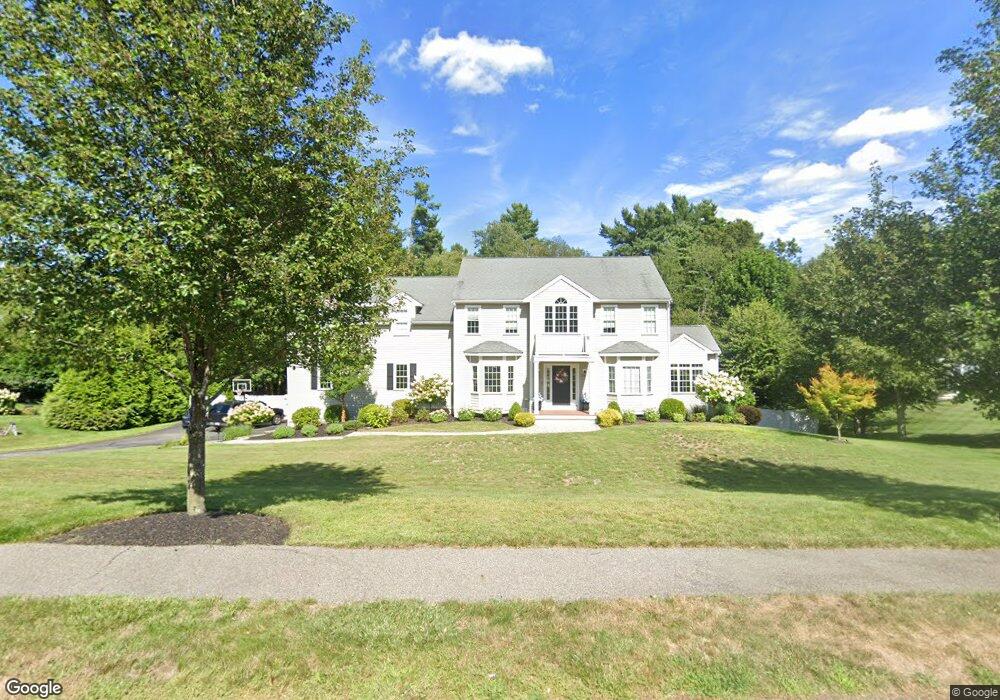
24 Meadow Dr Hanover, MA 02339
Estimated Value: $1,129,000 - $1,440,000
4
Beds
4
Baths
3,805
Sq Ft
$329/Sq Ft
Est. Value
About This Home
This home is located at 24 Meadow Dr, Hanover, MA 02339 and is currently estimated at $1,249,963, approximately $328 per square foot. 24 Meadow Dr is a home with nearby schools including Hanover High School, Cadence Academy Preschool - Hanover, and Cardinal Cushing Centers.
Ownership History
Date
Name
Owned For
Owner Type
Purchase Details
Closed on
May 15, 2009
Sold by
Leonard Rt and Johnson
Bought by
Gezotis Jon D and Gezotis Ellen
Current Estimated Value
Create a Home Valuation Report for This Property
The Home Valuation Report is an in-depth analysis detailing your home's value as well as a comparison with similar homes in the area
Home Values in the Area
Average Home Value in this Area
Purchase History
| Date | Buyer | Sale Price | Title Company |
|---|---|---|---|
| Gezotis Jon D | $300,000 | -- | |
| Gezotis Jon D | $300,000 | -- |
Source: Public Records
Mortgage History
| Date | Status | Borrower | Loan Amount |
|---|---|---|---|
| Open | Gezotis Jon D | $521,000 | |
| Closed | Gezotis Jon D | $521,000 | |
| Closed | Gezotis Jon D | $44,500 |
Source: Public Records
Tax History
| Year | Tax Paid | Tax Assessment Tax Assessment Total Assessment is a certain percentage of the fair market value that is determined by local assessors to be the total taxable value of land and additions on the property. | Land | Improvement |
|---|---|---|---|---|
| 2025 | $15,250 | $1,234,800 | $321,900 | $912,900 |
| 2024 | $14,740 | $1,148,000 | $321,900 | $826,100 |
| 2023 | $14,785 | $1,096,000 | $292,500 | $803,500 |
| 2022 | $13,551 | $888,600 | $257,400 | $631,200 |
| 2021 | $0 | $825,100 | $234,200 | $590,900 |
| 2020 | $5,535 | $821,000 | $255,500 | $565,500 |
| 2019 | $13,062 | $796,000 | $266,100 | $529,900 |
| 2018 | $12,529 | $769,600 | $285,300 | $484,300 |
| 2017 | $12,400 | $750,600 | $260,900 | $489,700 |
| 2016 | $11,650 | $691,000 | $237,200 | $453,800 |
| 2015 | $10,861 | $672,500 | $237,200 | $435,300 |
Source: Public Records
Map
Nearby Homes
- 114 Graham Hill Dr
- 51 Farmside Dr
- 339 State St
- 51 Cervelli Farm Dr
- 37 Dr
- 23 Cervelli Farm Dr
- 38 Cervelli Farm Dr
- 9 Cervelli Farm Dr
- 7 Farmside Dr
- 250 Center St
- 285 W Elm St
- 60 Summer Path Way
- 36 Grove St
- 186 Elm St
- 430 Brook Bend Rd
- 95 Tecumseh Dr
- 108 Waterford Dr
- 365 Broadway
- 70 River Rd
- 33 1st Parish Ln
- 12 Meadow Dr
- 10 Meadow Dr
- 40 Meadow Dr
- 8 Meadow Dr
- 4 Meadow Dr
- 13 Meadow Dr
- 3 Meadow Dr
- lot7 Meadow Dr
- 15 Meadow Dr
- lot 16 Trailside Ln
- lot2 Trailside Ln
- Lot 7 Meadow Dr
- lot 14 Meadow Dr
- 28 Trailside Ln
- 58 Meadow Dr
- 36 Trailside Ln
- LOT 2 Trailside Ln
- 14 Trailside Ln
- 14 Trailside Ln
- lot16 Trailside Ln
Your Personal Tour Guide
Ask me questions while you tour the home.