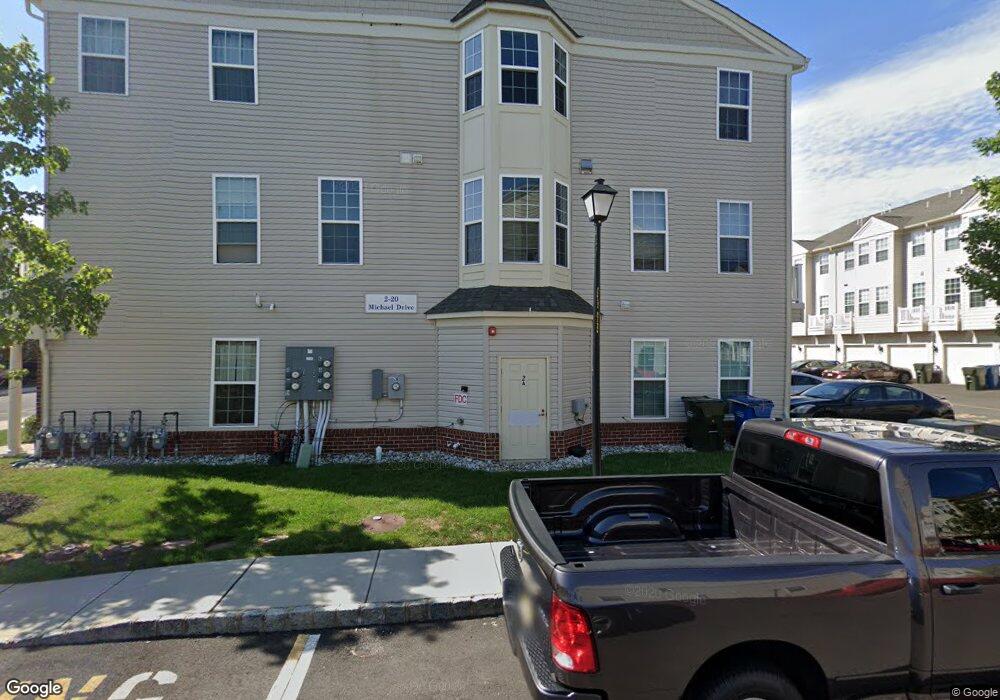
24 Michael Dr Tinton Falls, NJ 07712
Estimated Value: $440,000 - $468,000
2
Beds
2
Baths
1,140
Sq Ft
$396/Sq Ft
Est. Value
About This Home
This home is located at 24 Michael Dr, Tinton Falls, NJ 07712 and is currently estimated at $451,571, approximately $396 per square foot. 24 Michael Dr is a home with nearby schools including Mahala F. Atchinson Elementary School, Swimming River Elementary School, and Tinton Falls Middle School.
Ownership History
Date
Name
Owned For
Owner Type
Purchase Details
Closed on
Sep 22, 2015
Sold by
Nvr Inc
Bought by
Holway Amanda
Current Estimated Value
Home Financials for this Owner
Home Financials are based on the most recent Mortgage that was taken out on this home.
Original Mortgage
$195,080
Outstanding Balance
$153,431
Interest Rate
3.95%
Mortgage Type
New Conventional
Estimated Equity
$298,140
Purchase Details
Closed on
May 8, 2015
Sold by
Tinton Falls Active Adult Llc
Bought by
Nvr Inc and Ryan Homes
Create a Home Valuation Report for This Property
The Home Valuation Report is an in-depth analysis detailing your home's value as well as a comparison with similar homes in the area
Home Values in the Area
Average Home Value in this Area
Purchase History
| Date | Buyer | Sale Price | Title Company |
|---|---|---|---|
| Holway Amanda | $243,949 | Trident Abstract Title Agenc | |
| Nvr Inc | $89,500 | Title America |
Source: Public Records
Mortgage History
| Date | Status | Borrower | Loan Amount |
|---|---|---|---|
| Open | Holway Amanda | $195,080 |
Source: Public Records
Tax History
| Year | Tax Paid | Tax Assessment Tax Assessment Total Assessment is a certain percentage of the fair market value that is determined by local assessors to be the total taxable value of land and additions on the property. | Land | Improvement |
|---|---|---|---|---|
| 2025 | $5,783 | $434,500 | $233,600 | $200,900 |
| 2024 | $5,488 | $401,900 | $203,600 | $198,300 |
| 2023 | $5,488 | $359,600 | $165,000 | $194,600 |
| 2022 | $5,135 | $332,100 | $145,000 | $187,100 |
| 2021 | $5,135 | $266,600 | $110,000 | $156,600 |
| 2020 | $5,179 | $259,600 | $105,000 | $154,600 |
| 2019 | $5,086 | $255,300 | $100,000 | $155,300 |
| 2018 | $4,857 | $243,100 | $95,000 | $148,100 |
| 2017 | $4,891 | $238,700 | $95,000 | $143,700 |
| 2016 | $4,884 | $233,000 | $90,000 | $143,000 |
| 2015 | $4,643 | $21,300 | $21,300 | $0 |
| 2014 | $433 | $20,000 | $20,000 | $0 |
Source: Public Records
Map
Nearby Homes
- 3 Kyle Dr
- 58 Madison Ct
- 39 Des Moines Ct
- 25 Des Moines Ct
- 24 Topeka Ct
- 16 Karen Dr
- 75 Diane Dr
- 78 Diane Dr
- 57 Diane Dr
- 18 Diane Dr
- 52 Diane Dr
- 13 Cranberry Dr
- 14 Magnolia Ct
- 11 Rolling Meadows Blvd S
- 106 Rolling Meadows Blvd S
- 18 Charles Dr
- 1218 W Park Ave
- 16 Rolling Meadows Blvd S
- 38 Enclave Way
- 162 Frontier Way Unit 2