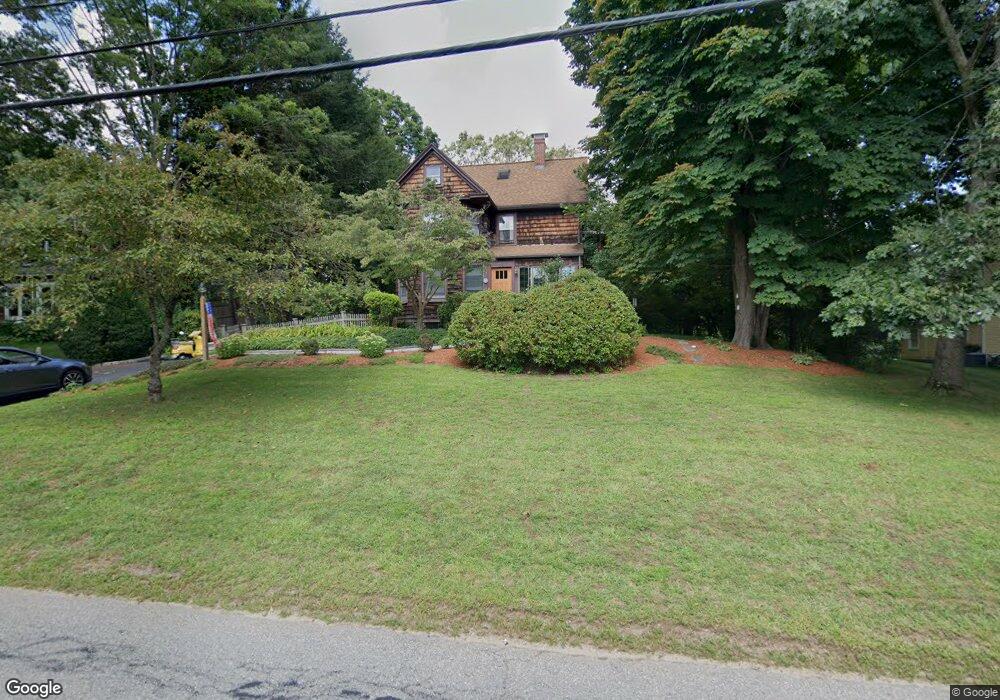
24 Millbrook Rd Wayland, MA 01778
Estimated Value: $1,072,400 - $1,195,000
4
Beds
3
Baths
2,422
Sq Ft
$465/Sq Ft
Est. Value
About This Home
This home is located at 24 Millbrook Rd, Wayland, MA 01778 and is currently estimated at $1,127,350, approximately $465 per square foot. 24 Millbrook Rd is a home located in Middlesex County with nearby schools including Wayland High School and Veritas Christian Academy.
Ownership History
Date
Name
Owned For
Owner Type
Purchase Details
Closed on
Oct 2, 2009
Sold by
Hagerstrom Kathy A and Slocum Nancy E
Bought by
Slocum Kathy A
Current Estimated Value
Home Financials for this Owner
Home Financials are based on the most recent Mortgage that was taken out on this home.
Original Mortgage
$417,000
Outstanding Balance
$267,977
Interest Rate
5.17%
Estimated Equity
$859,373
Purchase Details
Closed on
Dec 15, 1999
Sold by
Blahut Carl and Blahut Maryanne
Bought by
Cannon Gregory J and Cannon Carol B
Purchase Details
Closed on
Nov 5, 1990
Sold by
Kay Robert M
Bought by
Blahut Carl
Create a Home Valuation Report for This Property
The Home Valuation Report is an in-depth analysis detailing your home's value as well as a comparison with similar homes in the area
Home Values in the Area
Average Home Value in this Area
Purchase History
| Date | Buyer | Sale Price | Title Company |
|---|---|---|---|
| Slocum Kathy A | -- | -- | |
| Blahut Carl | $290,000 | -- | |
| Slocum Kathy A | -- | -- | |
| Cannon Gregory J | $374,000 | -- | |
| Blahut Carl | $290,000 | -- |
Source: Public Records
Mortgage History
| Date | Status | Borrower | Loan Amount |
|---|---|---|---|
| Open | Blahut Carl | $417,000 | |
| Previous Owner | Blahut Carl | $329,000 |
Source: Public Records
Tax History
| Year | Tax Paid | Tax Assessment Tax Assessment Total Assessment is a certain percentage of the fair market value that is determined by local assessors to be the total taxable value of land and additions on the property. | Land | Improvement |
|---|---|---|---|---|
| 2025 | $14,345 | $917,800 | $486,200 | $431,600 |
| 2024 | $13,580 | $875,000 | $463,000 | $412,000 |
| 2023 | $12,927 | $776,400 | $420,900 | $355,500 |
| 2022 | $12,245 | $667,300 | $348,600 | $318,700 |
| 2021 | $5,017 | $633,500 | $316,800 | $316,700 |
| 2020 | $4,799 | $623,500 | $316,800 | $306,700 |
| 2019 | $4,698 | $613,500 | $301,800 | $311,700 |
| 2018 | $10,160 | $563,500 | $301,800 | $261,700 |
| 2017 | $9,721 | $535,900 | $287,300 | $248,600 |
| 2016 | $9,263 | $534,200 | $281,700 | $252,500 |
| 2015 | $9,526 | $518,000 | $281,700 | $236,300 |
Source: Public Records
Map
Nearby Homes
- 1 Winthrop Terrace
- 17 Hastings Way Unit 17
- 156 Boston Post Rd
- 17 Glezen Ln
- 26 Jeffrey Rd
- 19 Old Connecticut Path
- 93 Draper Rd
- 218 Old Connecticut Path
- 823 Boston Post Rd
- 32 Highland Cir
- 1 Cole Rd
- 21 Westerly Rd
- 37 Davelin Rd
- 1605 Wisteria Way
- 6 Old County Rd Unit 16
- 9 Sanderson Ln
- 10 Audubon Rd
- 741 Boston Post Rd
- 63 Sudbury Rd
- 1 Pine Summit Cir
- 22 Millbrook Rd
- 26 Millbrook Rd
- 3 Brackett Rd
- 5 Nob Hill Rd
- 23 Millbrook Rd
- Lot 3 Brackett Rd
- 25 Millbrook Rd
- 20 Millbrook Rd
- 7 Nob Hill Rd
- 5 Brackett Rd
- 6 Nob Hill Rd
- 7 Brackett Rd
- 8 Brackett Rd
- 8 Nob Hill Rd
- 18 Millbrook Rd
- 32 Millbrook Rd
- 10 Brackett Rd
- 204 Boston Post Rd
- 31 Millbrook Rd
- 36 Millbrook Rd