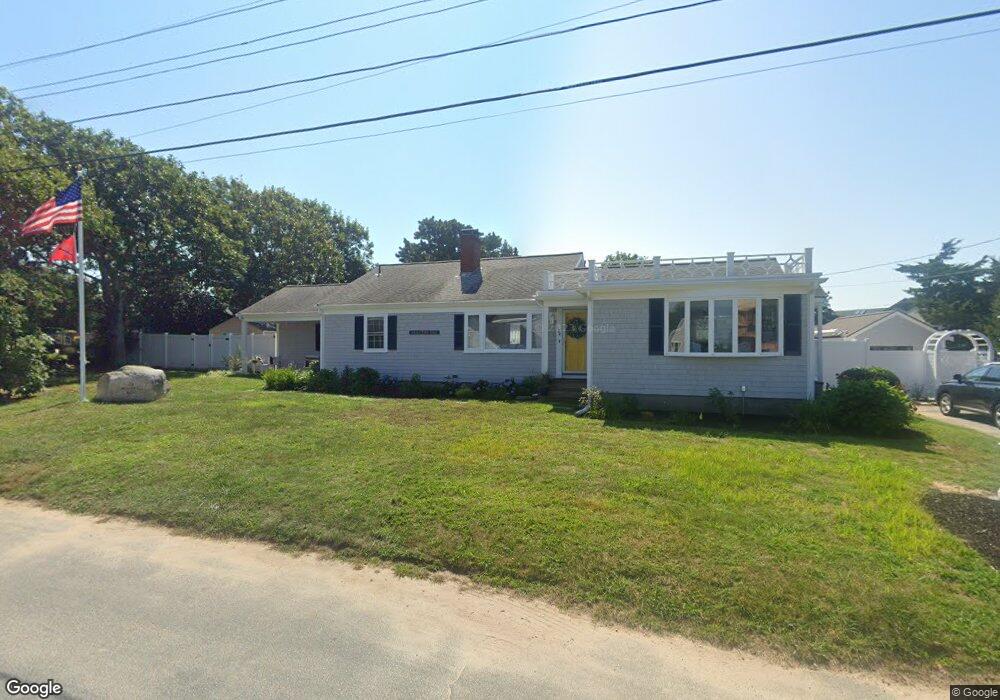
24 Mooring Rd Bourne, MA 2532
Estimated Value: $1,154,000 - $1,202,870
2
Beds
4
Baths
1,539
Sq Ft
$768/Sq Ft
Est. Value
About This Home
This home is located at 24 Mooring Rd, Bourne, MA 2532 and is currently estimated at $1,181,468, approximately $767 per square foot. 24 Mooring Rd is a home with nearby schools including Bourne High School.
Ownership History
Date
Name
Owned For
Owner Type
Purchase Details
Closed on
Aug 11, 2022
Sold by
Mooring Road Rt
Bought by
Johnson Andrew and Belliveau Elizabeth
Current Estimated Value
Home Financials for this Owner
Home Financials are based on the most recent Mortgage that was taken out on this home.
Original Mortgage
$784,000
Outstanding Balance
$750,660
Interest Rate
5.7%
Mortgage Type
Purchase Money Mortgage
Estimated Equity
$430,808
Purchase Details
Closed on
May 19, 2009
Sold by
Griffin Michael S and Griffin Virginia T
Bought by
Mooring Road Rt and Griffin
Home Financials for this Owner
Home Financials are based on the most recent Mortgage that was taken out on this home.
Original Mortgage
$248,000
Interest Rate
4.93%
Purchase Details
Closed on
Apr 16, 1996
Sold by
Ennis Richard A and Ennis Bernice K
Bought by
Griffin Michael S and Griffin Virginia T
Home Financials for this Owner
Home Financials are based on the most recent Mortgage that was taken out on this home.
Original Mortgage
$180,000
Interest Rate
7.39%
Mortgage Type
Purchase Money Mortgage
Create a Home Valuation Report for This Property
The Home Valuation Report is an in-depth analysis detailing your home's value as well as a comparison with similar homes in the area
Home Values in the Area
Average Home Value in this Area
Purchase History
| Date | Buyer | Sale Price | Title Company |
|---|---|---|---|
| Johnson Andrew | $980,000 | None Available | |
| Johnson Andrew | $980,000 | None Available | |
| Mooring Road Rt | -- | -- | |
| Mooring Road Rt | -- | -- | |
| Griffin Michael S | $225,000 | -- | |
| Griffin Michael S | $225,000 | -- |
Source: Public Records
Mortgage History
| Date | Status | Borrower | Loan Amount |
|---|---|---|---|
| Open | Johnson Andrew | $784,000 | |
| Closed | Johnson Andrew | $784,000 | |
| Previous Owner | Griffin Michael S | $248,000 | |
| Previous Owner | Griffin Michael S | $100,000 | |
| Previous Owner | Griffin Michael S | $180,000 |
Source: Public Records
Tax History Compared to Growth
Tax History
| Year | Tax Paid | Tax Assessment Tax Assessment Total Assessment is a certain percentage of the fair market value that is determined by local assessors to be the total taxable value of land and additions on the property. | Land | Improvement |
|---|---|---|---|---|
| 2025 | $8,061 | $1,032,100 | $567,000 | $465,100 |
| 2024 | $7,883 | $982,900 | $540,000 | $442,900 |
| 2023 | $7,678 | $871,500 | $477,900 | $393,600 |
| 2022 | $7,521 | $745,400 | $422,900 | $322,500 |
| 2021 | $7,680 | $713,100 | $417,000 | $296,100 |
| 2020 | $7,492 | $697,600 | $413,000 | $284,600 |
| 2019 | $7,197 | $684,800 | $413,000 | $271,800 |
| 2018 | $6,754 | $640,800 | $393,400 | $247,400 |
| 2017 | $6,969 | $676,600 | $431,600 | $245,000 |
| 2016 | $6,783 | $667,600 | $431,600 | $236,000 |
| 2015 | $6,358 | $631,400 | $431,600 | $199,800 |
Source: Public Records
Map
Nearby Homes