Estimated Value: $106,705 - $158,000
3
Beds
1
Bath
1,224
Sq Ft
$106/Sq Ft
Est. Value
About This Home
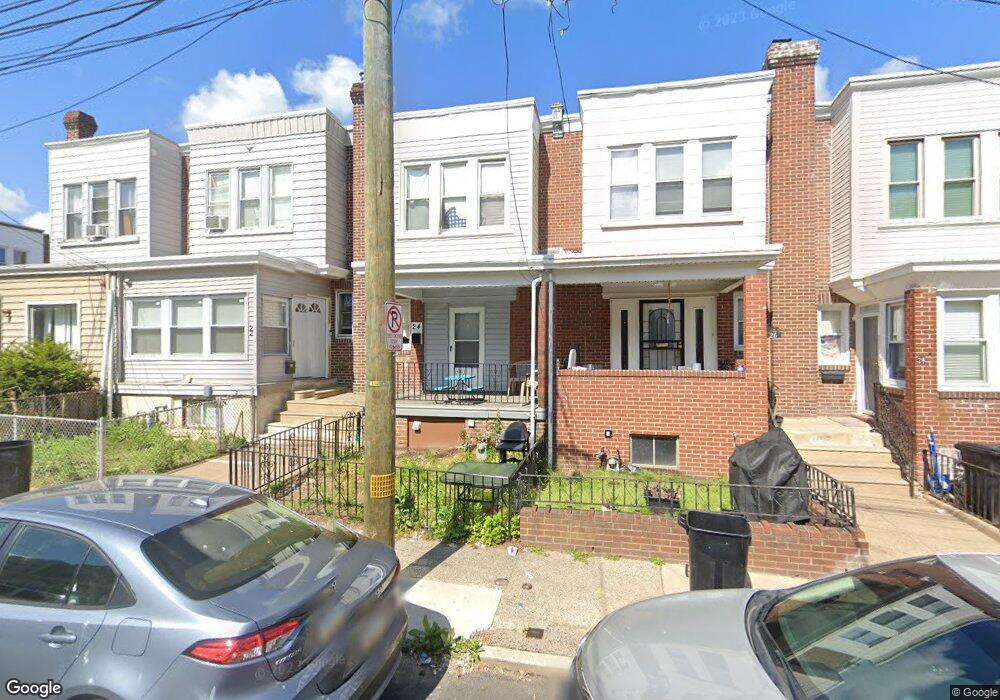
This home is located at 24 N 3rd St, Darby, PA 19023 and is currently estimated at $129,926, approximately $106 per square foot. 24 N 3rd St is a home located in Delaware County with nearby schools including Bell Avenue Elementary School, Penn Wood Middle School, and Penn Wood High School - Cypress Street Campus.
Ownership History
Date
Name
Owned For
Owner Type
Purchase Details
Closed on
Sep 11, 2002
Sold by
Hud
Bought by
Chorin Jason D
Current Estimated Value
Home Financials for this Owner
Home Financials are based on the most recent Mortgage that was taken out on this home.
Original Mortgage
$30,750
Outstanding Balance
$12,873
Interest Rate
6.27%
Estimated Equity
$117,053
Purchase Details
Closed on
May 31, 2002
Sold by
Bank Of America Fsb
Bought by
Hud
Purchase Details
Closed on
May 16, 2002
Sold by
Miller Linda C
Bought by
Bank Of America Fsb
Purchase Details
Closed on
Nov 17, 1995
Sold by
El William W and Ware William E
Bought by
Miller Linda C
Home Financials for this Owner
Home Financials are based on the most recent Mortgage that was taken out on this home.
Original Mortgage
$43,916
Interest Rate
7.37%
Mortgage Type
FHA
Create a Home Valuation Report for This Property
The Home Valuation Report is an in-depth analysis detailing your home's value as well as a comparison with similar homes in the area
Home Values in the Area
Average Home Value in this Area
Purchase History
| Date | Buyer | Sale Price | Title Company |
|---|---|---|---|
| Chorin Jason D | $22,501 | -- | |
| Hud | -- | -- | |
| Bank Of America Fsb | $5,000 | -- | |
| Miller Linda C | $43,500 | -- |
Source: Public Records
Mortgage History
| Date | Status | Borrower | Loan Amount |
|---|---|---|---|
| Open | Chorin Jason D | $30,750 | |
| Previous Owner | Miller Linda C | $43,916 |
Source: Public Records
Tax History
| Year | Tax Paid | Tax Assessment Tax Assessment Total Assessment is a certain percentage of the fair market value that is determined by local assessors to be the total taxable value of land and additions on the property. | Land | Improvement |
|---|---|---|---|---|
| 2025 | $2,228 | $45,000 | $19,970 | $25,030 |
| 2024 | $2,228 | $45,000 | $19,970 | $25,030 |
| 2023 | $2,097 | $45,000 | $19,970 | $25,030 |
| 2022 | $2,039 | $45,000 | $19,970 | $25,030 |
| 2021 | $2,846 | $45,000 | $19,970 | $25,030 |
| 2020 | $1,726 | $23,625 | $12,550 | $11,075 |
| 2019 | $1,653 | $23,625 | $12,550 | $11,075 |
| 2018 | $1,633 | $23,625 | $0 | $0 |
| 2017 | $1,603 | $23,625 | $0 | $0 |
| 2016 | $130 | $23,625 | $0 | $0 |
| 2015 | $132 | $23,625 | $0 | $0 |
| 2014 | $130 | $23,625 | $0 | $0 |
Source: Public Records
Map
Nearby Homes
Your Personal Tour Guide
Ask me questions while you tour the home.