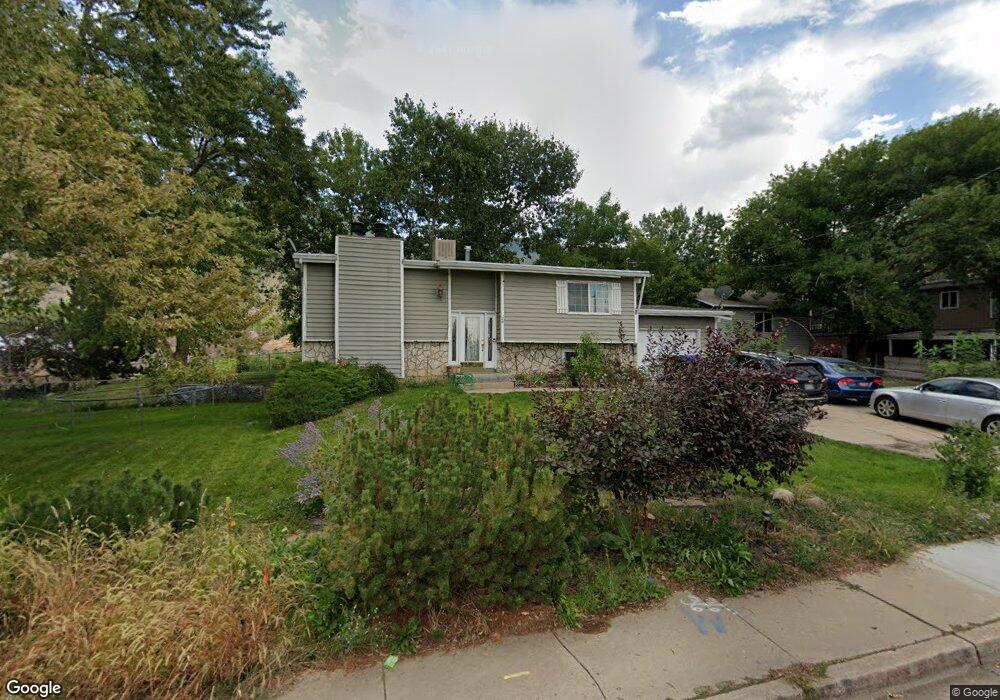
24 N 400 W Farmington, UT 84025
Estimated Value: $489,000 - $619,000
4
Beds
2
Baths
2,174
Sq Ft
$250/Sq Ft
Est. Value
About This Home
This home is located at 24 N 400 W, Farmington, UT 84025 and is currently estimated at $543,286, approximately $249 per square foot. 24 N 400 W is a home located in Davis County with nearby schools including Farmington Elementary School, Farmington High, and Farmington Junior High School.
Ownership History
Date
Name
Owned For
Owner Type
Purchase Details
Closed on
Jul 29, 2021
Sold by
Nielsen Quinn
Bought by
Nielsen Quinn and Nielsen Rebecca
Current Estimated Value
Home Financials for this Owner
Home Financials are based on the most recent Mortgage that was taken out on this home.
Original Mortgage
$277,000
Outstanding Balance
$251,992
Interest Rate
2.93%
Mortgage Type
New Conventional
Estimated Equity
$291,294
Purchase Details
Closed on
Jun 12, 2017
Sold by
Dendel Matthew H and Dendel Kimberly A
Bought by
Nielsen Quinn and Nielsen Rebecca
Home Financials for this Owner
Home Financials are based on the most recent Mortgage that was taken out on this home.
Original Mortgage
$306,150
Interest Rate
4.02%
Mortgage Type
New Conventional
Purchase Details
Closed on
Apr 15, 2005
Sold by
Dendel Matthew H
Bought by
Dendel Matthew H and Dendel Kimberly A
Home Financials for this Owner
Home Financials are based on the most recent Mortgage that was taken out on this home.
Original Mortgage
$165,445
Interest Rate
5.77%
Mortgage Type
FHA
Purchase Details
Closed on
Apr 8, 2005
Sold by
Dendel Mathew H and Dendel Kimbelry A
Bought by
Dendel Mathew H
Home Financials for this Owner
Home Financials are based on the most recent Mortgage that was taken out on this home.
Original Mortgage
$165,445
Interest Rate
5.77%
Mortgage Type
FHA
Create a Home Valuation Report for This Property
The Home Valuation Report is an in-depth analysis detailing your home's value as well as a comparison with similar homes in the area
Home Values in the Area
Average Home Value in this Area
Purchase History
| Date | Buyer | Sale Price | Title Company |
|---|---|---|---|
| Nielsen Quinn | -- | Accommodation | |
| Nielsen Quinn | -- | Inwest Title Service | |
| Nielsen Quinn | -- | Cottonwood Title | |
| Dendel Matthew H | -- | -- | |
| Dendel Mathew H | -- | Washtch Title Ins |
Source: Public Records
Mortgage History
| Date | Status | Borrower | Loan Amount |
|---|---|---|---|
| Open | Nielsen Quinn | $277,000 | |
| Closed | Nielsen Quinn | $306,150 | |
| Previous Owner | Dendel Mathew H | $165,445 |
Source: Public Records
Tax History Compared to Growth
Tax History
| Year | Tax Paid | Tax Assessment Tax Assessment Total Assessment is a certain percentage of the fair market value that is determined by local assessors to be the total taxable value of land and additions on the property. | Land | Improvement |
|---|---|---|---|---|
| 2024 | $2,343 | $234,300 | $165,982 | $68,318 |
| 2023 | $2,240 | $408,000 | $201,507 | $206,493 |
| 2022 | $2,259 | $233,750 | $111,595 | $122,155 |
| 2021 | $2,123 | $327,000 | $151,655 | $175,345 |
| 2020 | $1,918 | $288,000 | $126,411 | $161,589 |
| 2019 | $1,957 | $285,000 | $129,379 | $155,621 |
| 2018 | $1,832 | $263,000 | $128,076 | $134,924 |
| 2016 | $1,601 | $118,250 | $55,816 | $62,434 |
| 2015 | $1,580 | $110,770 | $55,816 | $54,954 |
| 2014 | $1,353 | $97,466 | $46,514 | $50,952 |
| 2013 | -- | $110,086 | $37,082 | $73,004 |
Source: Public Records
Map
Nearby Homes
- 52 N 400 W
- 372 W Clark Cir
- 38 S 300 W
- 21 N 100 W Unit 3
- 2 Grayson Way N Unit 11
- 1504 W Kiera Court Ct N Unit 150
- 170 N Main St
- 554 W Cottle Ln
- 442 W Randys Ct Unit 808
- 626 W Cottle Ln
- 69 W Grove Creek Cir
- 250 S 200 W
- 1460 W 550 N Unit 166
- 434 W 450 S Unit 815
- 514 Rigby Rd
- 139 E 400 N
- 60 N 1100 W
- 79 S 300 E
- 100 S 1100 W Unit 5
- 78 S 1100 W Unit 2
- 398 W State St
- 373 Pioneer Ln
- 382 W State St
- 604 W State St Unit 92
- 363 W Pioneer Ln
- 368 W State St
- 349 W Pioneer Ln
- 358 W Pioneer Ln
- 399 W State St
- 337 W Pioneer Ln
- 340 W State St
- 393 W State St
- 367 W State St
- 361 W State St
- 54 N Rodeo Ct
- 40 N Rodeo Ct
- 359 W State St Unit 110
- 359 W State St
- 344 W Pioneer Ln
- 330 W Pioneer Ln