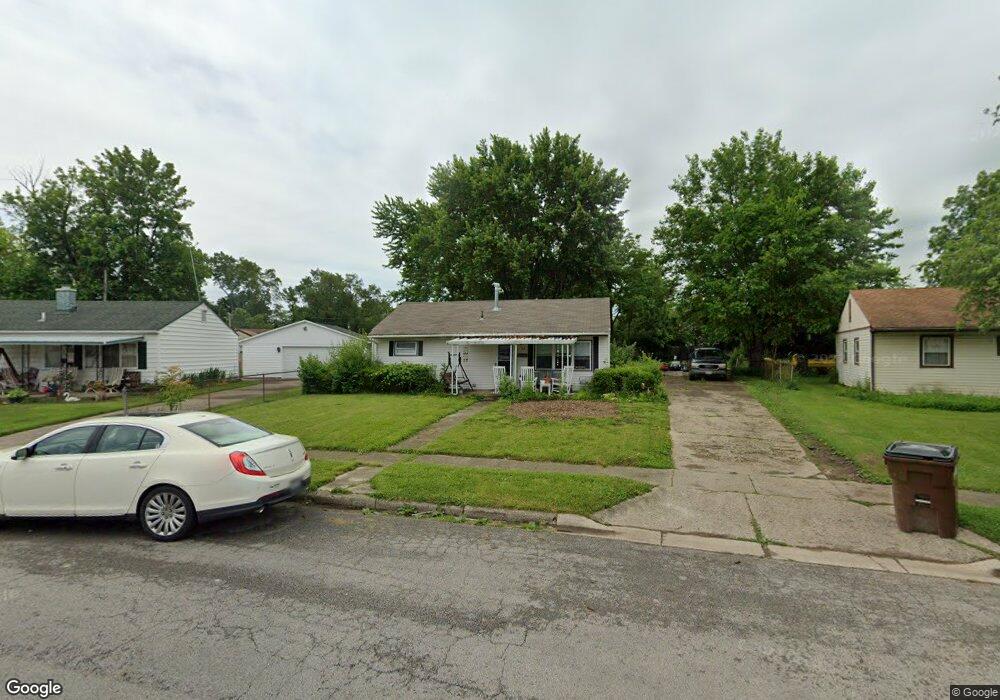
24 N Haven Dr Fairborn, OH 45324
Estimated Value: $84,000 - $142,000
3
Beds
1
Bath
816
Sq Ft
$151/Sq Ft
Est. Value
About This Home
This home is located at 24 N Haven Dr, Fairborn, OH 45324 and is currently estimated at $123,539, approximately $151 per square foot. 24 N Haven Dr is a home located in Greene County with nearby schools including Fairborn Primary School, Fairborn Intermediate School, and Fairborn Middle School.
Ownership History
Date
Name
Owned For
Owner Type
Purchase Details
Closed on
Aug 19, 2019
Sold by
Rose Bonnie E
Bought by
Vb One Llc
Current Estimated Value
Purchase Details
Closed on
Jul 28, 2008
Sold by
Johnson Gregory Ray
Bought by
Rose Bonnie E
Home Financials for this Owner
Home Financials are based on the most recent Mortgage that was taken out on this home.
Original Mortgage
$70,443
Interest Rate
6.51%
Mortgage Type
Purchase Money Mortgage
Purchase Details
Closed on
Aug 7, 1998
Sold by
Johnson Gregory Ray
Bought by
Johnson Gregory Ray and Johnson Connie L
Home Financials for this Owner
Home Financials are based on the most recent Mortgage that was taken out on this home.
Original Mortgage
$55,500
Interest Rate
6.99%
Purchase Details
Closed on
May 1, 1998
Sold by
Estate Of Shirley M Johnson
Bought by
Johnson Gregory Ray
Create a Home Valuation Report for This Property
The Home Valuation Report is an in-depth analysis detailing your home's value as well as a comparison with similar homes in the area
Home Values in the Area
Average Home Value in this Area
Purchase History
| Date | Buyer | Sale Price | Title Company |
|---|---|---|---|
| Vb One Llc | $54,000 | None Available | |
| Rose Bonnie E | $35,500 | None Available | |
| Rose Bonnie E | $35,500 | None Available | |
| Johnson Gregory Ray | -- | Gem City Land Title Agency I | |
| Johnson Gregory Ray | -- | -- |
Source: Public Records
Mortgage History
| Date | Status | Borrower | Loan Amount |
|---|---|---|---|
| Previous Owner | Rose Bonnie E | $70,443 | |
| Previous Owner | Johnson Gregory Ray | $55,500 |
Source: Public Records
Tax History Compared to Growth
Tax History
| Year | Tax Paid | Tax Assessment Tax Assessment Total Assessment is a certain percentage of the fair market value that is determined by local assessors to be the total taxable value of land and additions on the property. | Land | Improvement |
|---|---|---|---|---|
| 2024 | $1,578 | $32,940 | $11,040 | $21,900 |
| 2023 | $1,578 | $32,940 | $11,040 | $21,900 |
| 2022 | $1,226 | $21,550 | $7,890 | $13,660 |
| 2021 | $1,244 | $21,550 | $7,890 | $13,660 |
| 2020 | $1,250 | $21,550 | $7,890 | $13,660 |
| 2019 | $1,119 | $19,300 | $7,730 | $11,570 |
| 2018 | $1,130 | $19,300 | $7,730 | $11,570 |
| 2017 | $1,106 | $19,300 | $7,730 | $11,570 |
| 2016 | $1,251 | $19,270 | $7,730 | $11,540 |
| 2015 | $1,193 | $19,270 | $7,730 | $11,540 |
| 2014 | $1,158 | $19,270 | $7,730 | $11,540 |
Source: Public Records
Map
Nearby Homes
- 5 Marchmont Dr
- 3 Holgate Ct
- 20 Ramona Dr
- 97 Marchmont Dr
- 43 Lindway Dr
- 849 Flintridge Dr
- 849 S Maple Ave
- 852 Princeton Ave
- 44 Brockway Ct
- 1108 Lexington Ave
- 849 Princeton Ave
- 860 Washington Ave
- 493 Florence Ave
- 322 Shade Dr
- 1121 Lexington Ave
- 608 S Maple Ave
- 1040 S Central Ave
- 1033 Victoria Ave
- 66 S Central Ave
- 1230 Ironwood Dr