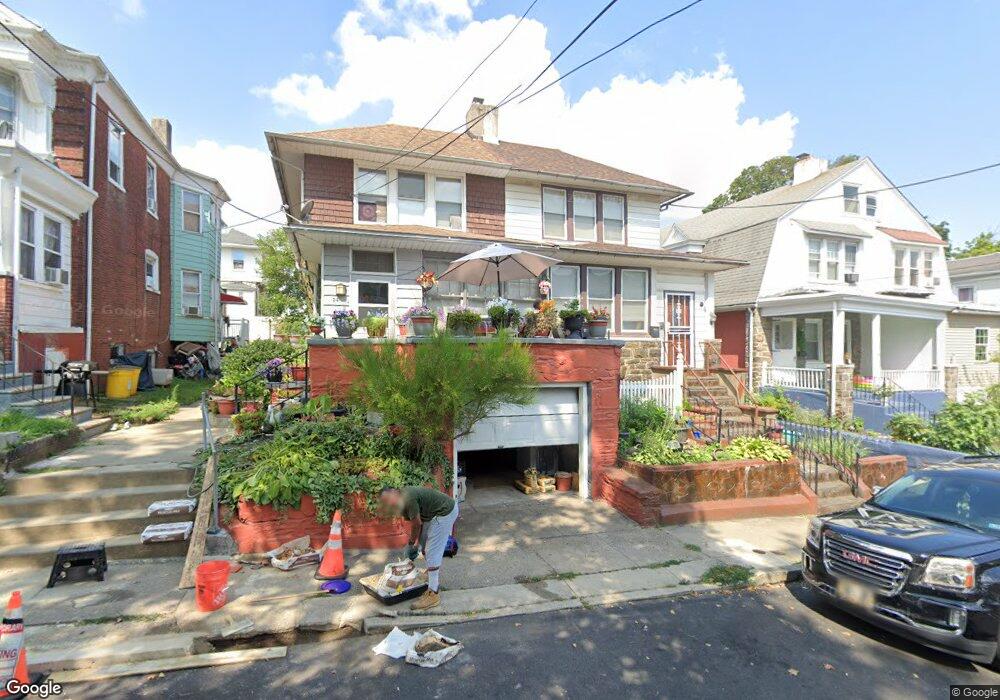
24 N Millbourne Ave Upper Darby, PA 19082
Estimated Value: $234,335 - $310,000
4
Beds
1
Bath
1,927
Sq Ft
$148/Sq Ft
Est. Value
About This Home
This home is located at 24 N Millbourne Ave, Upper Darby, PA 19082 and is currently estimated at $284,834, approximately $147 per square foot. 24 N Millbourne Ave is a home located in Delaware County with nearby schools including Upper Darby Kdg Center, Charles Kelly El School, and Upper Darby High School.
Ownership History
Date
Name
Owned For
Owner Type
Purchase Details
Closed on
May 16, 2002
Sold by
Swearer Jonathan
Bought by
Swearer William and Swearer Richard William
Current Estimated Value
Home Financials for this Owner
Home Financials are based on the most recent Mortgage that was taken out on this home.
Original Mortgage
$35,750
Outstanding Balance
$14,723
Interest Rate
6.58%
Mortgage Type
Stand Alone First
Estimated Equity
$270,111
Purchase Details
Closed on
Nov 30, 2001
Sold by
Lauren Mcsorley Llp
Bought by
Swearer William
Purchase Details
Closed on
Feb 2, 2001
Sold by
Tax Claim Bureau
Bought by
Lauren Mcsorley Llp
Purchase Details
Closed on
Jun 27, 2000
Sold by
Swearer Christina and Swearer Jonathan
Bought by
Swearer Jonathan and Swearer Richard William
Purchase Details
Closed on
Sep 15, 1997
Sold by
Catania Maria
Bought by
Swearer Christina
Purchase Details
Closed on
Feb 14, 1995
Sold by
Santucci Sophie R
Bought by
Santucci Sophie
Create a Home Valuation Report for This Property
The Home Valuation Report is an in-depth analysis detailing your home's value as well as a comparison with similar homes in the area
Home Values in the Area
Average Home Value in this Area
Purchase History
| Date | Buyer | Sale Price | Title Company |
|---|---|---|---|
| Swearer William | -- | -- | |
| Swearer William | $11,500 | -- | |
| Lauren Mcsorley Llp | $7,500 | -- | |
| Swearer Jonathan | -- | -- | |
| Swearer Christina | -- | -- | |
| Santucci Sophie | -- | -- |
Source: Public Records
Mortgage History
| Date | Status | Borrower | Loan Amount |
|---|---|---|---|
| Open | Swearer William | $35,750 |
Source: Public Records
Tax History Compared to Growth
Tax History
| Year | Tax Paid | Tax Assessment Tax Assessment Total Assessment is a certain percentage of the fair market value that is determined by local assessors to be the total taxable value of land and additions on the property. | Land | Improvement |
|---|---|---|---|---|
| 2025 | $3,808 | $98,000 | $33,290 | $64,710 |
| 2024 | $3,808 | $98,000 | $33,290 | $64,710 |
| 2023 | $2,732 | $98,000 | $33,290 | $64,710 |
| 2022 | $6,598 | $98,000 | $33,290 | $64,710 |
| 2021 | $8,194 | $98,000 | $33,290 | $64,710 |
| 2020 | $3,915 | $57,940 | $18,640 | $39,300 |
| 2019 | $3,874 | $57,940 | $18,640 | $39,300 |
| 2018 | $3,832 | $57,940 | $0 | $0 |
| 2017 | $3,851 | $57,940 | $0 | $0 |
| 2016 | $318 | $57,940 | $0 | $0 |
| 2015 | $324 | $57,940 | $0 | $0 |
| 2014 | $318 | $57,940 | $0 | $0 |
Source: Public Records
Map
Nearby Homes
- 26 N Millbourne Ave
- 22 N Millbourne Ave
- 28 N Millbourne Ave
- 20 N Millbourne Ave
- 30 N Millbourne Ave
- 32 N Millbourne Ave
- 23 Sellers Ave
- 21 Sellers Ave
- 16 N Millbourne Ave
- 25 Sellers Ave
- 19 Sellers Ave
- 27 Sellers Ave
- 34 N Millbourne Ave
- 17 Sellers Ave
- 29 Sellers Ave
- 14 N Millbourne Ave
- 31 Sellers Ave
- 23 N Millbourne Ave
- 12 N Millbourne Ave
- 25 N Millbourne Ave