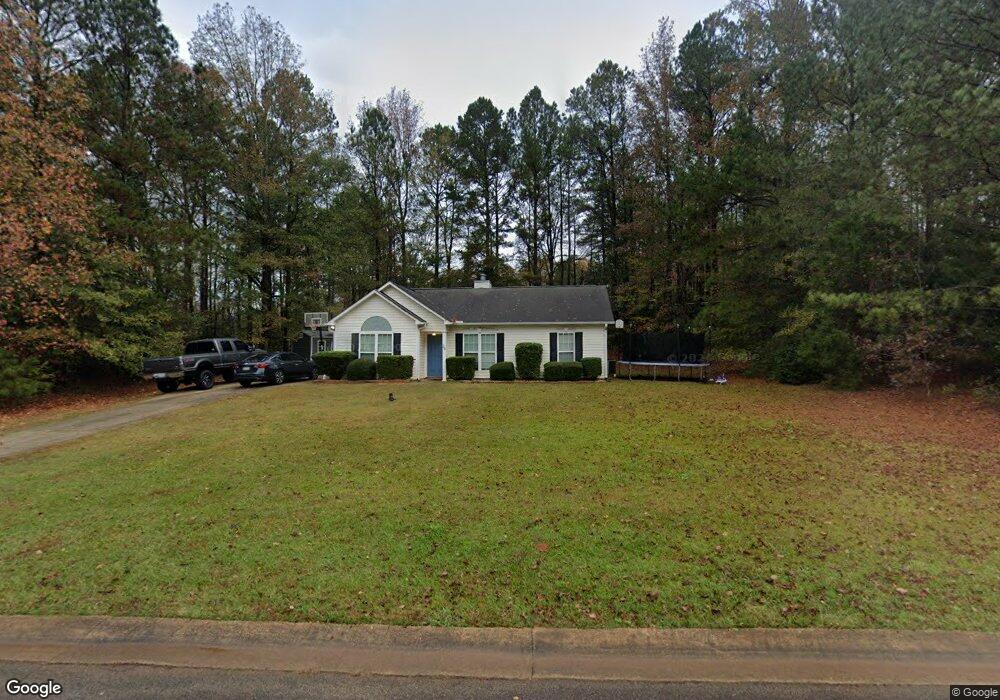
24 Nantucket Dr Unit 32 Lagrange, GA 30241
Estimated Value: $208,257 - $270,000
3
Beds
2
Baths
1,168
Sq Ft
$198/Sq Ft
Est. Value
About This Home
This home is located at 24 Nantucket Dr Unit 32, Lagrange, GA 30241 and is currently estimated at $231,564, approximately $198 per square foot. 24 Nantucket Dr Unit 32 is a home located in Troup County with nearby schools including Callaway Elementary School, Hogansville Elementary School, and Callaway Middle School.
Ownership History
Date
Name
Owned For
Owner Type
Purchase Details
Closed on
Apr 20, 2020
Sold by
Shaw Nathan Donald
Bought by
Parsons Shamara Makia
Current Estimated Value
Home Financials for this Owner
Home Financials are based on the most recent Mortgage that was taken out on this home.
Original Mortgage
$130,492
Outstanding Balance
$115,270
Interest Rate
3.25%
Mortgage Type
FHA
Estimated Equity
$116,294
Purchase Details
Closed on
Oct 30, 2014
Sold by
Blanks Sandra R
Bought by
Shaw Nathan Donald and Shaw Lori Lynn
Home Financials for this Owner
Home Financials are based on the most recent Mortgage that was taken out on this home.
Original Mortgage
$96,938
Interest Rate
4.26%
Mortgage Type
New Conventional
Purchase Details
Closed on
May 14, 2004
Sold by
Dri Cottages Llc
Bought by
Sims John M and Sims Sandra R
Purchase Details
Closed on
Jan 30, 2002
Bought by
Dri Cottages Llc
Create a Home Valuation Report for This Property
The Home Valuation Report is an in-depth analysis detailing your home's value as well as a comparison with similar homes in the area
Home Values in the Area
Average Home Value in this Area
Purchase History
| Date | Buyer | Sale Price | Title Company |
|---|---|---|---|
| Parsons Shamara Makia | $132,900 | -- | |
| Shaw Nathan Donald | $95,000 | -- | |
| Sims John M | $101,900 | -- | |
| Dri Cottages Llc | -- | -- |
Source: Public Records
Mortgage History
| Date | Status | Borrower | Loan Amount |
|---|---|---|---|
| Open | Parsons Shamara Makia | $130,492 | |
| Previous Owner | Shaw Nathan Donald | $96,938 |
Source: Public Records
Tax History Compared to Growth
Tax History
| Year | Tax Paid | Tax Assessment Tax Assessment Total Assessment is a certain percentage of the fair market value that is determined by local assessors to be the total taxable value of land and additions on the property. | Land | Improvement |
|---|---|---|---|---|
| 2024 | $1,702 | $64,384 | $14,000 | $50,384 |
| 2023 | $1,605 | $60,828 | $14,000 | $46,828 |
| 2022 | $1,400 | $52,168 | $10,000 | $42,168 |
| 2021 | $1,559 | $51,704 | $10,000 | $41,704 |
| 2020 | $1,363 | $45,184 | $10,000 | $35,184 |
| 2019 | $1,165 | $38,616 | $8,000 | $30,616 |
| 2018 | $1,165 | $38,616 | $8,000 | $30,616 |
| 2017 | $1,165 | $38,616 | $8,000 | $30,616 |
| 2016 | $1,128 | $37,397 | $8,000 | $29,397 |
| 2015 | $999 | $33,065 | $4,060 | $29,005 |
| 2014 | $715 | $25,621 | $4,060 | $21,561 |
| 2013 | -- | $27,551 | $4,060 | $23,491 |
Source: Public Records
Map
Nearby Homes
- 229 Big Springs Mountville Rd
- 142 Carr Rd
- 4117 Greenville Rd
- 494 Thrash Rd
- 829 Thrash Rd
- 0 Fincher St
- 592 Mountville Hogansville Rd
- 15 Frost School Rd
- 4973 Greenville Rd
- 49 Lagrange Hwy
- 1701 Hines Rd
- 91 Almond Rd
- 453 E Mount Zion Church Rd
- 2477 Upper Big Springs Rd
- 0 Alverson Rd
- 425 Mount Zion Church Rd
- Cypress Plan at Antler Ridge
- 1220 Lagrange Hwy
- 37.23 ACRES / 0 Smokey Rd
- 547 Hines Rd
- 24 Nantucket Dr
- 40 Nantucket Dr
- 29 Nantucket Dr
- 22 Nantucket Dr
- 31 Nantucket Dr
- 29 Nantucket Dr
- 42 Nantucket Dr
- 27 Nantucket Dr
- 37 Nantucket Dr
- 41 Nantucket Dr
- 33 Nantucket Dr
- 35 Nantucket Dr
- 2 Cape Ann Ct
- 1 Cape Ann Ct
- 43 Nantucket Dr
- 25 Nantucket Dr
- 45 Nantucket Dr
- 47 Nantucket Dr
- 23 Nantucket Dr
- 522 Big Springs Mountville Rd