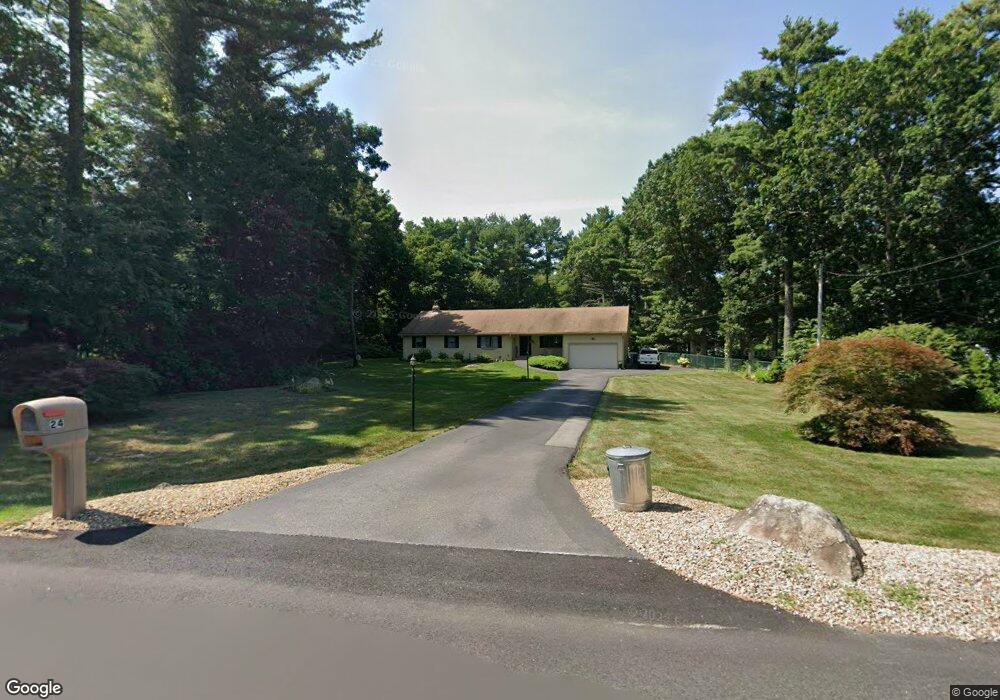
24 Orchard St Berkley, MA 02779
Estimated Value: $599,000 - $787,000
3
Beds
2
Baths
2,330
Sq Ft
$289/Sq Ft
Est. Value
About This Home
This home is located at 24 Orchard St, Berkley, MA 02779 and is currently estimated at $672,335, approximately $288 per square foot. 24 Orchard St is a home located in Bristol County with nearby schools including Berkley Community School and Our Lady of Lourdes School.
Ownership History
Date
Name
Owned For
Owner Type
Purchase Details
Closed on
Jan 14, 2019
Sold by
Carlos Jeffrey and Carlos Lisa
Bought by
Carlos Ft
Current Estimated Value
Purchase Details
Closed on
May 1, 1984
Bought by
Carlos Jeffrey
Create a Home Valuation Report for This Property
The Home Valuation Report is an in-depth analysis detailing your home's value as well as a comparison with similar homes in the area
Purchase History
| Date | Buyer | Sale Price | Title Company |
|---|---|---|---|
| Carlos Ft | -- | -- | |
| Carlos Jeffrey | -- | -- |
Source: Public Records
Mortgage History
| Date | Status | Borrower | Loan Amount |
|---|---|---|---|
| Previous Owner | Carlos Jeffrey | $82,000 | |
| Previous Owner | Carlos Jeffrey | $204,000 | |
| Previous Owner | Carlos Jeffrey | $195,500 |
Source: Public Records
Tax History
| Year | Tax Paid | Tax Assessment Tax Assessment Total Assessment is a certain percentage of the fair market value that is determined by local assessors to be the total taxable value of land and additions on the property. | Land | Improvement |
|---|---|---|---|---|
| 2025 | $73 | $605,700 | $145,000 | $460,700 |
| 2024 | $7,075 | $568,300 | $124,900 | $443,400 |
| 2023 | $6,728 | $508,900 | $124,900 | $384,000 |
| 2022 | $6,593 | $479,500 | $108,600 | $370,900 |
| 2021 | $6,407 | $448,700 | $103,400 | $345,300 |
| 2020 | $6,354 | $437,300 | $91,500 | $345,800 |
| 2019 | $6,152 | $420,200 | $91,500 | $328,700 |
| 2018 | $5,629 | $401,500 | $88,000 | $313,500 |
| 2017 | $5,393 | $377,100 | $98,600 | $278,500 |
| 2016 | $5,163 | $347,900 | $98,600 | $249,300 |
| 2015 | $4,892 | $351,700 | $98,600 | $253,100 |
| 2014 | $4,615 | $360,300 | $107,000 | $253,300 |
Source: Public Records
Map
Nearby Homes
- 1969 County St
- 71 Tania Dr
- 220 Erin Rd
- 0 Anthony St
- 2 Bc Ln
- 2 Lima Ln
- LOT 2A Hudson Dr Unit 2A
- 0 Hart St Unit 73474079
- 73 Seymour St
- 143 Morrison Rd
- 298 Wren St
- 328 Caswell St
- 600 County St
- 9 Akron Ln
- 28 B Staples St Unit B
- 23 Elmwood Dr
- 12 Beacon St
- 90 E Water St
- 59 Linden St Unit 307
- 29 Johnson St Unit C
Your Personal Tour Guide
Ask me questions while you tour the home.