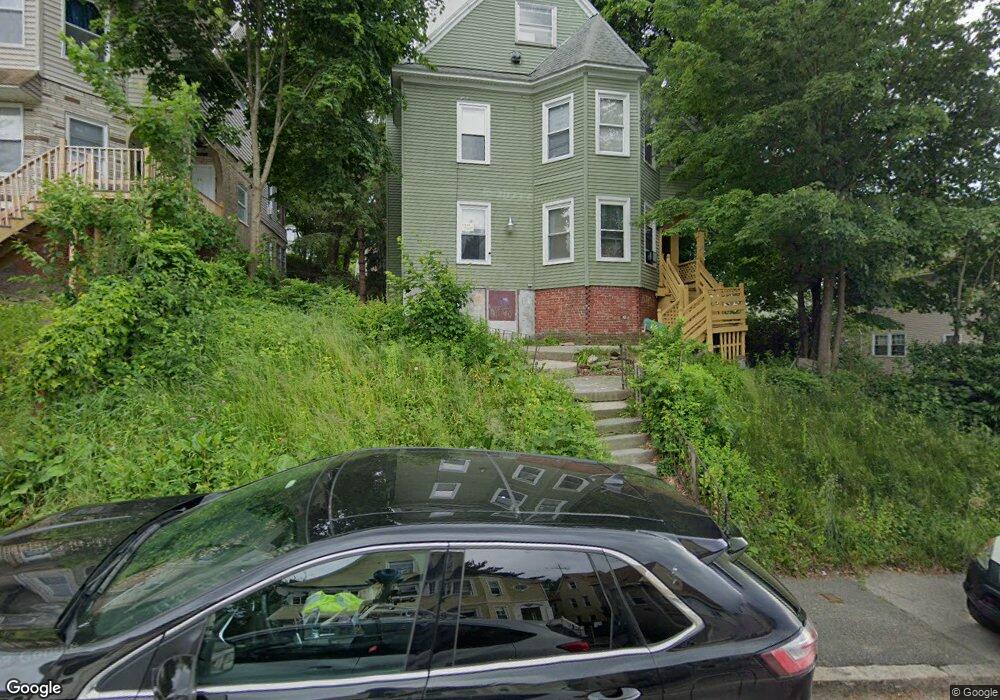
24 Orne St Worcester, MA 01605
Brittan Square NeighborhoodEstimated Value: $482,484 - $643,000
4
Beds
2
Baths
2,677
Sq Ft
$210/Sq Ft
Est. Value
About This Home
This home is located at 24 Orne St, Worcester, MA 01605 and is currently estimated at $562,371, approximately $210 per square foot. 24 Orne St is a home located in Worcester County with nearby schools including Jacob Hiatt Magnet School, Chandler Magnet, and Burncoat Middle School.
Ownership History
Date
Name
Owned For
Owner Type
Purchase Details
Closed on
Jul 24, 2025
Sold by
Tomaszewski Ryszard
Bought by
Marvi Junaid and Siddiqui Shahla
Current Estimated Value
Home Financials for this Owner
Home Financials are based on the most recent Mortgage that was taken out on this home.
Original Mortgage
$1,100,000
Outstanding Balance
$1,097,193
Interest Rate
6.84%
Mortgage Type
New Conventional
Estimated Equity
-$534,822
Purchase Details
Closed on
Jul 20, 2009
Sold by
Deutsche Bk Natl T Co
Bought by
Tomaszewski Ryszard
Purchase Details
Closed on
Jun 6, 2007
Sold by
Oleary Daniel J and Deutsche Bank Natl T C
Bought by
Deutsche Bank Natl T C
Purchase Details
Closed on
Aug 17, 2004
Sold by
Oleary Daniel J
Bought by
Oleary Daniel J and Hathaway Patricia J
Home Financials for this Owner
Home Financials are based on the most recent Mortgage that was taken out on this home.
Original Mortgage
$76,000
Interest Rate
6.16%
Mortgage Type
Purchase Money Mortgage
Purchase Details
Closed on
Mar 24, 2000
Sold by
Ferrie William J Est and Ferrie
Bought by
Oleary Daniel J
Create a Home Valuation Report for This Property
The Home Valuation Report is an in-depth analysis detailing your home's value as well as a comparison with similar homes in the area
Home Values in the Area
Average Home Value in this Area
Purchase History
| Date | Buyer | Sale Price | Title Company |
|---|---|---|---|
| Marvi Junaid | $1,375,000 | -- | |
| Marvi Junaid | $1,375,000 | -- | |
| Tomaszewski Ryszard | $32,900 | -- | |
| Tomaszewski Ryszard | $32,900 | -- | |
| Tomaszewski Ryszard | $32,900 | -- | |
| Deutsche Bank Natl T C | $148,423 | -- | |
| Deutsche Bank Natl T C | $148,423 | -- | |
| Deutsche Bank Natl T C | $148,423 | -- | |
| Oleary Daniel J | -- | -- | |
| Oleary Daniel J | -- | -- | |
| Oleary Daniel J | -- | -- | |
| Oleary Daniel J | $75,000 | -- | |
| Oleary Daniel J | $75,000 | -- |
Source: Public Records
Mortgage History
| Date | Status | Borrower | Loan Amount |
|---|---|---|---|
| Open | Marvi Junaid | $1,100,000 | |
| Closed | Marvi Junaid | $1,100,000 | |
| Previous Owner | Oleary Daniel J | $76,000 |
Source: Public Records
Tax History
| Year | Tax Paid | Tax Assessment Tax Assessment Total Assessment is a certain percentage of the fair market value that is determined by local assessors to be the total taxable value of land and additions on the property. | Land | Improvement |
|---|---|---|---|---|
| 2025 | $5,905 | $447,700 | $85,600 | $362,100 |
| 2024 | $5,600 | $407,300 | $85,600 | $321,700 |
| 2023 | $5,231 | $364,800 | $74,400 | $290,400 |
| 2022 | $4,412 | $316,900 | $59,600 | $257,300 |
| 2021 | $4,412 | $271,000 | $47,700 | $223,300 |
| 2020 | $4,112 | $241,900 | $47,300 | $194,600 |
| 2019 | $4,109 | $228,300 | $41,300 | $187,000 |
| 2018 | $4,005 | $211,800 | $41,300 | $170,500 |
| 2017 | $3,804 | $197,900 | $41,300 | $156,600 |
| 2016 | $3,790 | $183,900 | $30,100 | $153,800 |
| 2015 | $3,691 | $183,900 | $30,100 | $153,800 |
| 2014 | $3,593 | $183,900 | $30,100 | $153,800 |
Source: Public Records
Map
Nearby Homes
- 26 Orne St
- 78 Green Hill Pkwy
- 74 Green Hill Pkwy
- 176 Lincoln St Unit 4
- 139 Lincoln St
- 3 Perkins St
- 249 Lincoln St
- 27 Harlow St
- 33 Denmark St
- 24 Catharine St
- 15 Breck St
- Lot 2 Ararat
- 21 Kendall St
- 145 Eastern Ave
- 2 Selden St
- 20B Edgeworth St
- 63 North St Unit D
- 63 North St Unit C
- 63 North St Unit B
- 63 North St Unit A
Your Personal Tour Guide
Ask me questions while you tour the home.