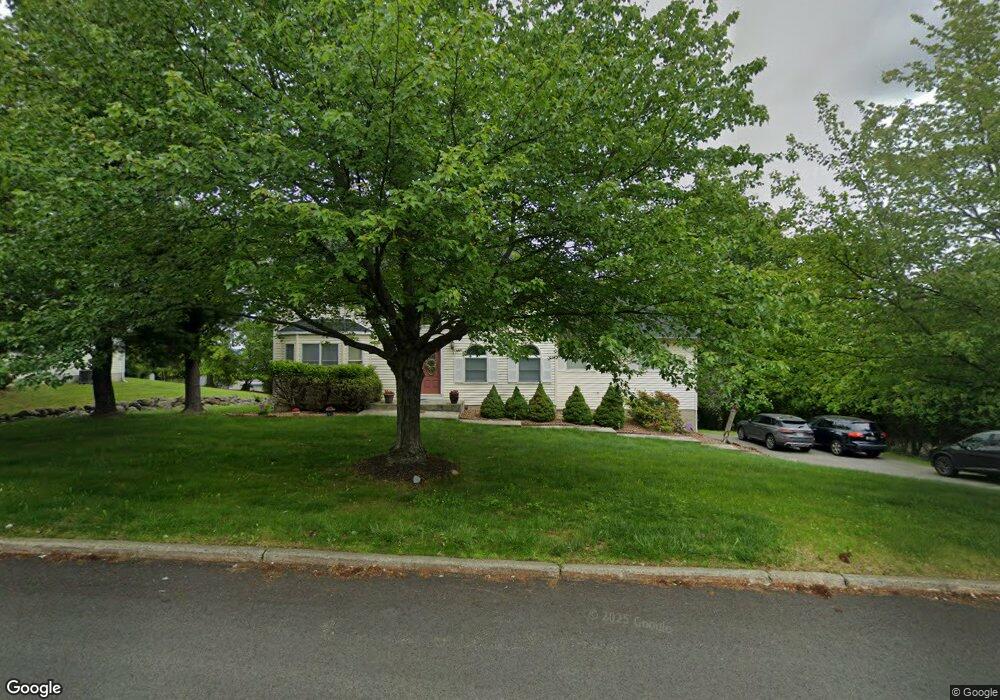
24 Ossman Dr Pomona, NY 10970
Estimated Value: $891,000 - $1,079,000
5
Beds
3
Baths
2,690
Sq Ft
$365/Sq Ft
Est. Value
About This Home
This home is located at 24 Ossman Dr, Pomona, NY 10970 and is currently estimated at $982,057, approximately $365 per square foot. 24 Ossman Dr is a home located in Rockland County with nearby schools including Thiells Elementary School, Willow Grove Middle School, and Fieldstone Secondary School.
Ownership History
Date
Name
Owned For
Owner Type
Purchase Details
Closed on
Oct 25, 2021
Sold by
Mathew Shaji and Mathew Joseph Seno
Bought by
Mathew Shaji and Mathew Cigi
Current Estimated Value
Home Financials for this Owner
Home Financials are based on the most recent Mortgage that was taken out on this home.
Original Mortgage
$110,022
Outstanding Balance
$100,816
Interest Rate
2.99%
Mortgage Type
New Conventional
Estimated Equity
$881,241
Purchase Details
Closed on
Nov 9, 2006
Sold by
Nath Ila
Bought by
Mathew Shaji
Home Financials for this Owner
Home Financials are based on the most recent Mortgage that was taken out on this home.
Original Mortgage
$408,000
Outstanding Balance
$255,158
Interest Rate
7.25%
Mortgage Type
Purchase Money Mortgage
Estimated Equity
$726,899
Create a Home Valuation Report for This Property
The Home Valuation Report is an in-depth analysis detailing your home's value as well as a comparison with similar homes in the area
Home Values in the Area
Average Home Value in this Area
Purchase History
| Date | Buyer | Sale Price | Title Company |
|---|---|---|---|
| Mathew Shaji | -- | None Available | |
| Mathew Shaji | $510,000 | Robert D Fenster | |
| Mathew Shaji | $510,000 | None Available |
Source: Public Records
Mortgage History
| Date | Status | Borrower | Loan Amount |
|---|---|---|---|
| Open | Mathew Shaji | $110,022 | |
| Open | Mathew Shaji | $408,000 | |
| Closed | Mathew Shaji | $408,000 |
Source: Public Records
Tax History Compared to Growth
Tax History
| Year | Tax Paid | Tax Assessment Tax Assessment Total Assessment is a certain percentage of the fair market value that is determined by local assessors to be the total taxable value of land and additions on the property. | Land | Improvement |
|---|---|---|---|---|
| 2024 | $28,711 | $377,600 | $143,000 | $234,600 |
| 2023 | $28,711 | $377,600 | $143,000 | $234,600 |
| 2022 | $5,867 | $377,600 | $143,000 | $234,600 |
| 2021 | $28,406 | $377,600 | $143,000 | $234,600 |
| 2020 | $16,929 | $377,600 | $143,000 | $234,600 |
| 2019 | $5,188 | $377,600 | $143,000 | $234,600 |
| 2018 | $16,521 | $377,600 | $143,000 | $234,600 |
| 2017 | $15,504 | $377,600 | $143,000 | $234,600 |
| 2016 | $15,467 | $377,600 | $143,000 | $234,600 |
| 2015 | -- | $377,600 | $143,000 | $234,600 |
| 2014 | -- | $377,600 | $143,000 | $234,600 |
Source: Public Records
Map
Nearby Homes
- 27 Ossman Dr
- 11 Rockridge Dr
- 21 Nytko Dr
- 49 Phyllis Dr
- 45 Underhill Dr Unit 134
- 117 Buckingham Ct Unit 117
- 334 Richard Ct
- 332 Richard Ct Unit 33B
- 112 Buckingham Ct
- 81 Crystal Hill Dr
- 27 Crystal Hill Dr Unit 102
- 466 Country Club Ln
- 15 Woodridge Dr
- 505 Country Club Ln Unit 505
- 20 Crystal Hill Dr
- 11 Gleason Dr
- 12 Gleason Dr
- 252 Country Club Ln Unit 252
- 262 Country Club Ln Unit 262
- 146 Country Club Ln Unit 146