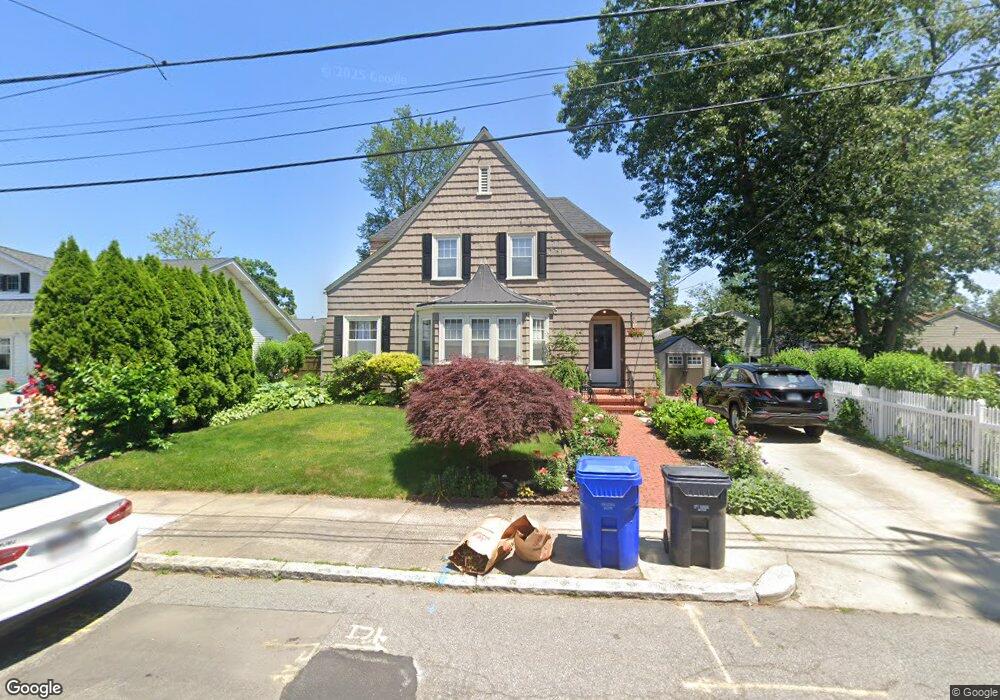
24 Paris St Pawtucket, RI 02860
Oak Hill NeighborhoodEstimated Value: $653,000 - $693,000
3
Beds
2
Baths
1,500
Sq Ft
$447/Sq Ft
Est. Value
About This Home
This home is located at 24 Paris St, Pawtucket, RI 02860 and is currently estimated at $670,100, approximately $446 per square foot. 24 Paris St is a home located in Providence County with nearby schools including International Charter School, Blackstone Academy Charter School, and Jewish Community Day School Of Rhode Island.
Ownership History
Date
Name
Owned For
Owner Type
Purchase Details
Closed on
Nov 29, 2016
Sold by
Dresner Marle T
Bought by
Bianco Robert and Bianco Debra
Current Estimated Value
Purchase Details
Closed on
Sep 9, 2005
Sold by
Marandola Louis
Bought by
Bianco Robert A and Bianco Debra A
Purchase Details
Closed on
Mar 31, 2003
Sold by
Max Leo
Bought by
Marandola Louis
Create a Home Valuation Report for This Property
The Home Valuation Report is an in-depth analysis detailing your home's value as well as a comparison with similar homes in the area
Home Values in the Area
Average Home Value in this Area
Purchase History
| Date | Buyer | Sale Price | Title Company |
|---|---|---|---|
| Bianco Robert | $87,000 | -- | |
| Bianco Robert A | $385,000 | -- | |
| Marandola Louis | $297,000 | -- |
Source: Public Records
Mortgage History
| Date | Status | Borrower | Loan Amount |
|---|---|---|---|
| Previous Owner | Marandola Louis | $373,000 | |
| Previous Owner | Marandola Louis | $388,000 | |
| Previous Owner | Marandola Louis | $500,000 |
Source: Public Records
Tax History
| Year | Tax Paid | Tax Assessment Tax Assessment Total Assessment is a certain percentage of the fair market value that is determined by local assessors to be the total taxable value of land and additions on the property. | Land | Improvement |
|---|---|---|---|---|
| 2025 | $6,858 | $521,500 | $327,600 | $193,900 |
| 2024 | $6,435 | $521,500 | $327,600 | $193,900 |
| 2023 | $6,464 | $381,600 | $222,400 | $159,200 |
| 2022 | $6,327 | $381,600 | $222,400 | $159,200 |
| 2021 | $6,327 | $381,600 | $222,400 | $159,200 |
| 2020 | $6,294 | $301,300 | $182,000 | $119,300 |
| 2019 | $5,532 | $301,300 | $182,000 | $119,300 |
| 2018 | $6,065 | $301,300 | $182,000 | $119,300 |
| 2017 | $5,819 | $256,100 | $160,900 | $95,200 |
| 2016 | $5,606 | $256,100 | $160,900 | $95,200 |
| 2015 | $5,606 | $256,100 | $160,900 | $95,200 |
| 2014 | $5,574 | $241,700 | $160,900 | $80,800 |
Source: Public Records
Map
Nearby Homes
Your Personal Tour Guide
Ask me questions while you tour the home.