
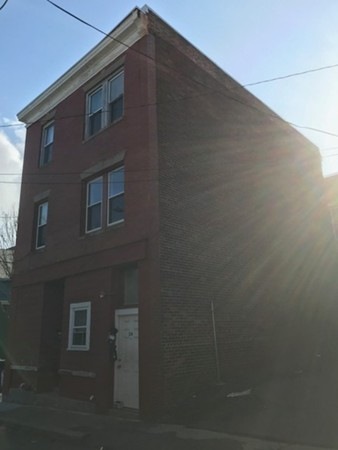


24 Park St Salem, MA 01970
The Point Neighborhood
5
Beds
4
Baths
2,580
Sq Ft
1,307
Sq Ft Lot
About This Home
As of October 2020Investors take note! Cash cow BRICK 3 unit building within walking distance to downtown and nearby Salem State! Current rents below market but still generating over $45k in gross rents and ~7% cap rate w/ minimal expenses and separately metered utilities! 1st floor is on lease at $1,250/mo; Room to raise rents instantly on 2nd ($1300) and 3rd floor ($1250) which are both TAW. Lots of potential to raise rents and generate 8%+ cap, LT potential of double digit cap rate in rapidly maturing location w/ stability of built-in market of Salem State! Major items have been taken care of- Brand new main sewer pipe, new furnace for second floor, newer bathrooms in all units, and durable rubber roof! Units are very well laid out two bedrooms with large eat in kitchens. 2nd and 3rd floor can easily be rented as 3 beds offering great potential to raise rents to $1800+. Do not miss this one of a kind value proposition. Significant opportunity to generate strong income and build wealth in real estate!
Last Agent to Sell the Property
Dan Groob
Prime Property Group Listed on: 04/25/2018
Property Details
Home Type
- Multi-Family
Est. Annual Taxes
- $7,979
Year Built
- Built in 1915
Additional Features
- Porch
- Natural Gas Water Heater
- Basement
Ownership History
Date
Name
Owned For
Owner Type
Purchase Details
Listed on
Jun 7, 2020
Closed on
Oct 2, 2020
Sold by
Am Saccoccio Ft
Bought by
Snyder Kris
Seller's Agent
Stakem Team
Leading Edge Real Estate
Buyer's Agent
Lisa Santamaria
Aluxety
List Price
$569,900
Sold Price
$520,000
Premium/Discount to List
-$49,900
-8.76%
Current Estimated Value
Home Financials for this Owner
Home Financials are based on the most recent Mortgage that was taken out on this home.
Estimated Appreciation
$262,510
Avg. Annual Appreciation
8.91%
Purchase Details
Closed on
Oct 2, 2018
Sold by
Saccoccio Augusto
Bought by
Am Saccoccio Ft and Saccoccio
Purchase Details
Listed on
Apr 25, 2018
Closed on
Jun 4, 2018
Sold by
Rabb Jordan T
Bought by
Saccoccio Augusto
Seller's Agent
Dan Groob
Prime Property Group
Buyer's Agent
Mark Stakem
Leading Edge Real Estate
List Price
$549,000
Sold Price
$545,000
Premium/Discount to List
-$4,000
-0.73%
Home Financials for this Owner
Home Financials are based on the most recent Mortgage that was taken out on this home.
Avg. Annual Appreciation
5.19%
Original Mortgage
$408,750
Interest Rate
4.4%
Mortgage Type
New Conventional
Purchase Details
Closed on
Dec 26, 2014
Sold by
Jb Capital Llc
Bought by
Rabb Jordan T
Purchase Details
Listed on
Mar 4, 2014
Closed on
May 9, 2014
Sold by
Us Bank Na Tr
Bought by
Jb Capital Llc
Seller's Agent
Janet Boccelli
Vylla Home
Buyer's Agent
Janet Boccelli
Vylla Home
List Price
$210,000
Sold Price
$200,000
Premium/Discount to List
-$10,000
-4.76%
Home Financials for this Owner
Home Financials are based on the most recent Mortgage that was taken out on this home.
Avg. Annual Appreciation
12.93%
Purchase Details
Closed on
Feb 8, 2013
Sold by
Broglino Richard T
Bought by
Us Bank Na
Purchase Details
Closed on
Oct 24, 2002
Sold by
Rosenberg Barry A
Bought by
Broglino Richard T
Purchase Details
Closed on
Jul 27, 2001
Sold by
Parella Marc R
Bought by
Rosenberg Barry A
Purchase Details
Closed on
Feb 15, 2001
Sold by
Norwest Bk Minnesota
Bought by
Parrella Marc R
Purchase Details
Closed on
Jun 18, 1996
Sold by
Whitcomb Edward A and Whitcomb Chang
Bought by
Thomas Stacy J
Purchase Details
Closed on
Oct 25, 1991
Sold by
Fnma
Bought by
Whitcomb Whitcomb Edward A Edward A and Chang S Whitcomb
Similar Homes in the area
Create a Home Valuation Report for This Property
The Home Valuation Report is an in-depth analysis detailing your home's value as well as a comparison with similar homes in the area
Home Values in the Area
Average Home Value in this Area
Purchase History
| Date | Type | Sale Price | Title Company |
|---|---|---|---|
| Not Resolvable | $520,000 | None Available | |
| Deed | -- | -- | |
| Deed | -- | -- | |
| Not Resolvable | $545,000 | -- | |
| Not Resolvable | $359,000 | -- | |
| Not Resolvable | $200,000 | -- | |
| Foreclosure Deed | $150,000 | -- | |
| Foreclosure Deed | $150,000 | -- | |
| Deed | $325,000 | -- | |
| Deed | $325,000 | -- | |
| Deed | $220,000 | -- | |
| Deed | $220,000 | -- | |
| Deed | $129,900 | -- | |
| Deed | $97,399 | -- | |
| Deed | $97,399 | -- | |
| Deed | $72,000 | -- | |
| Deed | $72,000 | -- | |
| Deed | $63,000 | -- | |
| Deed | $63,000 | -- |
Source: Public Records
Mortgage History
| Date | Status | Loan Amount | Loan Type |
|---|---|---|---|
| Open | $225,000 | Commercial | |
| Previous Owner | $408,750 | New Conventional |
Source: Public Records
Property History
| Date | Event | Price | Change | Sq Ft Price |
|---|---|---|---|---|
| 10/09/2020 10/09/20 | Sold | $520,000 | -4.9% | $202 / Sq Ft |
| 07/13/2020 07/13/20 | Pending | -- | -- | -- |
| 06/30/2020 06/30/20 | Price Changed | $547,000 | -2.3% | $212 / Sq Ft |
| 06/22/2020 06/22/20 | Price Changed | $559,900 | -1.8% | $217 / Sq Ft |
| 06/07/2020 06/07/20 | For Sale | $569,900 | +4.6% | $221 / Sq Ft |
| 06/04/2018 06/04/18 | Sold | $545,000 | -0.7% | $211 / Sq Ft |
| 05/01/2018 05/01/18 | Pending | -- | -- | -- |
| 04/25/2018 04/25/18 | For Sale | $549,000 | +174.5% | $213 / Sq Ft |
| 05/07/2014 05/07/14 | Sold | $200,000 | -4.8% | $78 / Sq Ft |
| 04/07/2014 04/07/14 | Pending | -- | -- | -- |
| 03/04/2014 03/04/14 | For Sale | $210,000 | -- | $81 / Sq Ft |
Source: MLS Property Information Network (MLS PIN)
Tax History Compared to Growth
Tax History
| Year | Tax Paid | Tax Assessment Tax Assessment Total Assessment is a certain percentage of the fair market value that is determined by local assessors to be the total taxable value of land and additions on the property. | Land | Improvement |
|---|---|---|---|---|
| 2025 | $7,979 | $703,600 | $138,300 | $565,300 |
| 2024 | $7,741 | $666,200 | $138,300 | $527,900 |
| 2023 | $7,483 | $598,200 | $122,000 | $476,200 |
| 2022 | $7,143 | $539,100 | $113,900 | $425,200 |
| 2021 | $7,328 | $531,000 | $106,300 | $424,700 |
| 2020 | $6,511 | $450,600 | $78,400 | $372,200 |
| 2019 | $5,711 | $378,200 | $69,200 | $309,000 |
| 2018 | $5,328 | $346,400 | $69,200 | $277,200 |
| 2017 | $5,080 | $320,300 | $59,000 | $261,300 |
| 2016 | $5,019 | $320,300 | $59,000 | $261,300 |
| 2015 | $4,250 | $259,000 | $50,700 | $208,300 |
Source: Public Records
Agents Affiliated with this Home
-
S
Seller's Agent in 2020
Stakem Team
Leading Edge Real Estate
(781) 944-6060
1 in this area
108 Total Sales
-
Seller Co-Listing Agent in 2020
Mark Stakem
Leading Edge Real Estate
(781) 944-6060
1 in this area
28 Total Sales
-
L
Buyer's Agent in 2020
Lisa Santamaria
Aluxety
(978) 239-4753
1 in this area
10 Total Sales
-
D
Seller's Agent in 2018
Dan Groob
Prime Property Group
-
J
Seller's Agent in 2014
Janet Boccelli
Vylla Home
(617) 594-8558
6 Total Sales
Map
Source: MLS Property Information Network (MLS PIN)
MLS Number: 72314380
APN: SALE-000034-000000-000308
Disclaimer: Certain information contained herein is derived from information provided by parties other than Homes.com. All information provided is deemed reliable, but is not guaranteed to be accurate and should be independently verified.
![]() The property listing data and information, or the Images, set forth herein were provided to MLS Property Information Network, Inc. from third party sources, including sellers, lessors and public records, and were compiled by MLS Property Information Network, Inc. The property listing data and information, and the Images, are for the personal, non-commercial use of consumers having a good faith interest in purchasing or leasing listed properties of the type displayed to them and may not be used for any purpose other than to identify prospective properties which such consumers may have a good faith interest in purchasing or leasing. MLS Property Information Network, Inc. and its subscribers disclaim any and all representations and warranties as to the accuracy of the property listing data and information, or as to the accuracy of any of the Images, set forth herein.
The property listing data and information, or the Images, set forth herein were provided to MLS Property Information Network, Inc. from third party sources, including sellers, lessors and public records, and were compiled by MLS Property Information Network, Inc. The property listing data and information, and the Images, are for the personal, non-commercial use of consumers having a good faith interest in purchasing or leasing listed properties of the type displayed to them and may not be used for any purpose other than to identify prospective properties which such consumers may have a good faith interest in purchasing or leasing. MLS Property Information Network, Inc. and its subscribers disclaim any and all representations and warranties as to the accuracy of the property listing data and information, or as to the accuracy of any of the Images, set forth herein.
Nearby Homes
- 88 Congress St Unit 6
- 33 Harbor St
- 69 Harbor St
- 56 Peabody St Unit 2W
- 8 Ward St
- 18 Ropes St Unit 1L
- 51 Lafayette St Unit 506
- 51 Lafayette St Unit 304
- 80 Wharf St Unit K3
- 3 Saltonstall Pkwy
- 90 Wharf St Unit 11
- 102 Margin St
- 107 Campbell St
- 17 Central St Unit 10
- 9 Hancock St
- 24 Cabot St Unit 1
- 20 Central St Unit 405
- 20 Central St Unit 402
- 8-8.5 Herbert St
- 23 Union St Unit 2