Estimated Value: $322,911 - $408,000
Studio
--
Bath
1,368
Sq Ft
$276/Sq Ft
Est. Value
About This Home
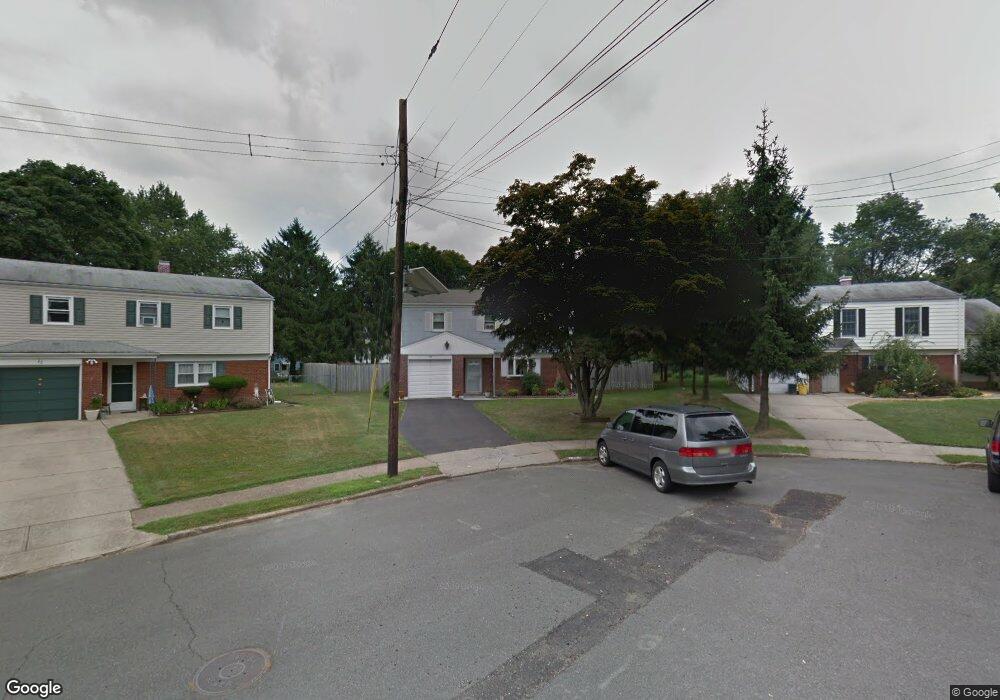
This home is located at 24 Peck Ave, Ewing, NJ 08618 and is currently estimated at $377,228, approximately $275 per square foot. 24 Peck Ave is a home located in Mercer County with nearby schools including Ewing High School, The Village Charter School, and Trenton Stem-To-Civics Charter School.
Ownership History
Date
Name
Owned For
Owner Type
Purchase Details
Closed on
Nov 14, 2007
Sold by
Jones James N and Jones Karen A
Bought by
Tauqeer Iman and Haque Afshan
Current Estimated Value
Home Financials for this Owner
Home Financials are based on the most recent Mortgage that was taken out on this home.
Original Mortgage
$245,000
Outstanding Balance
$155,812
Interest Rate
6.48%
Mortgage Type
New Conventional
Estimated Equity
$221,416
Purchase Details
Closed on
Jul 8, 2004
Sold by
Doyle John
Bought by
Jones James and Jones Karen
Home Financials for this Owner
Home Financials are based on the most recent Mortgage that was taken out on this home.
Original Mortgage
$225,950
Interest Rate
6.33%
Purchase Details
Closed on
Jun 22, 2000
Sold by
Elder Anne
Bought by
Doyle John and Leff Tracey
Home Financials for this Owner
Home Financials are based on the most recent Mortgage that was taken out on this home.
Original Mortgage
$114,950
Interest Rate
8.48%
Mortgage Type
FHA
Create a Home Valuation Report for This Property
The Home Valuation Report is an in-depth analysis detailing your home's value as well as a comparison with similar homes in the area
Home Values in the Area
Average Home Value in this Area
Purchase History
| Date | Buyer | Sale Price | Title Company |
|---|---|---|---|
| Tauqeer Iman | $255,000 | -- | |
| Jones James | $225,950 | -- | |
| Doyle John | $116,495 | -- |
Source: Public Records
Mortgage History
| Date | Status | Borrower | Loan Amount |
|---|---|---|---|
| Open | Tauqeer Iman | $245,000 | |
| Previous Owner | Jones James | $225,950 | |
| Previous Owner | Doyle John | $114,950 |
Source: Public Records
Tax History
| Year | Tax Paid | Tax Assessment Tax Assessment Total Assessment is a certain percentage of the fair market value that is determined by local assessors to be the total taxable value of land and additions on the property. | Land | Improvement |
|---|---|---|---|---|
| 2025 | $7,193 | $182,900 | $61,000 | $121,900 |
| 2024 | $6,762 | $182,900 | $61,000 | $121,900 |
Source: Public Records
Map
Nearby Homes
- 21 Dixmont Ave
- 33 Stratford Ave
- 1060 Terrace Blvd
- 126 Rutledge Ave
- 991 Terrace Blvd
- 288 Clamer Rd
- 41 Harding St
- 409 Silvia St
- 152 Franklyn Rd
- 1200 Silvia St
- 71 Carlton Ave
- 322 Wynnewood Rd
- 20 Steinway Ave
- 860 Lower Ferry Rd Unit 5P
- 860 Lower Ferry Rd Unit 2K
- 37 van Duyn Dr
- 24 Glen Stewart Dr
- 768 Parkway Ave
- 107 Kyle Way
- 18 Kyle Way
- 22 Peck Ave
- 26 Peck Ave
- 1131 Lower Ferry Rd
- 1135 Lower Ferry Rd
- 20 Peck Ave
- 1129 Lower Ferry Rd
- 28 Peck Ave
- 1137 Lower Ferry Rd
- 1141 Lower Ferry Rd
- 18 Peck Ave
- 30 Peck Ave
- 1127 Lower Ferry Rd
- 1145 Lower Ferry Rd
- 16 Peck Ave
- 1 Dixmont Ave
- 2 Dixmont Ave
- 1123 Lower Ferry Rd
- 1149 Lower Ferry Rd
- 1136 Lower Ferry Rd
- 1142 UNIT A Lower Ferry Rd
Your Personal Tour Guide
Ask me questions while you tour the home.