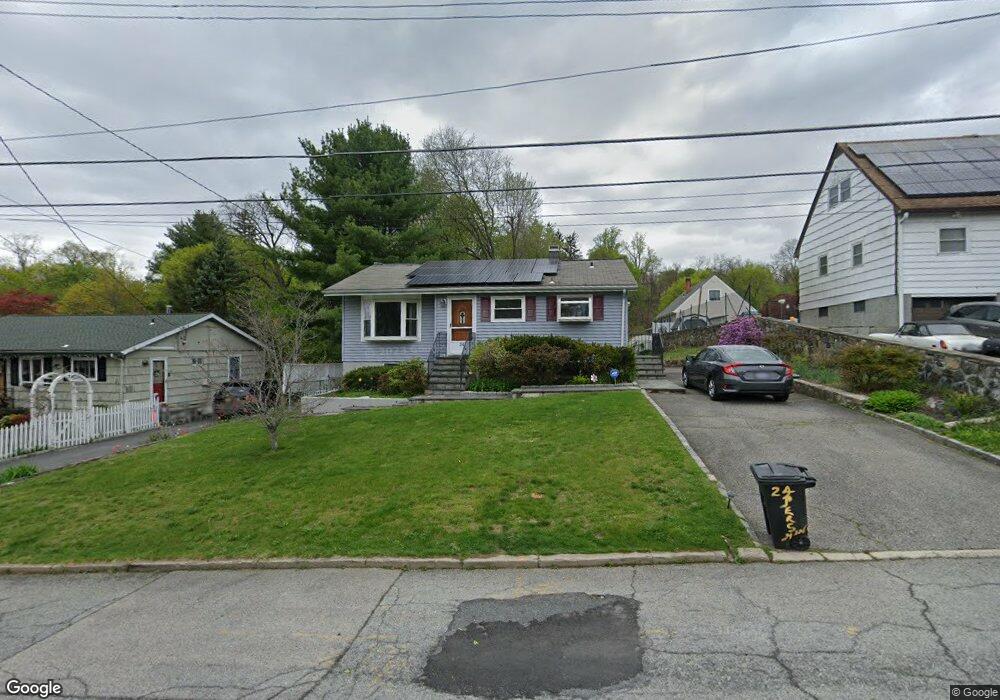
24 Pershing Ave Ossining, NY 10562
Estimated Value: $495,000 - $577,000
2
Beds
1
Bath
984
Sq Ft
$540/Sq Ft
Est. Value
About This Home
This home is located at 24 Pershing Ave, Ossining, NY 10562 and is currently estimated at $530,868, approximately $539 per square foot. 24 Pershing Ave is a home located in Westchester County with nearby schools including Park School, Roosevelt Elementary School, and Brookside Elementary School.
Ownership History
Date
Name
Owned For
Owner Type
Purchase Details
Closed on
Jun 11, 2021
Sold by
Baker Charles Arnot and Baker Charles A
Bought by
Baker Charles A and Baker Linnet Albertha
Current Estimated Value
Home Financials for this Owner
Home Financials are based on the most recent Mortgage that was taken out on this home.
Original Mortgage
$600,000
Interest Rate
2.57%
Mortgage Type
Reverse Mortgage Home Equity Conversion Mortgage
Create a Home Valuation Report for This Property
The Home Valuation Report is an in-depth analysis detailing your home's value as well as a comparison with similar homes in the area
Home Values in the Area
Average Home Value in this Area
Purchase History
| Date | Buyer | Sale Price | Title Company |
|---|---|---|---|
| Baker Charles A | -- | Fnc Title Services |
Source: Public Records
Mortgage History
| Date | Status | Borrower | Loan Amount |
|---|---|---|---|
| Closed | Baker Charles A | $600,000 |
Source: Public Records
Tax History Compared to Growth
Tax History
| Year | Tax Paid | Tax Assessment Tax Assessment Total Assessment is a certain percentage of the fair market value that is determined by local assessors to be the total taxable value of land and additions on the property. | Land | Improvement |
|---|---|---|---|---|
| 2024 | -- | $439,800 | $154,400 | $285,400 |
| 2023 | $9,488 | $414,300 | $154,400 | $259,900 |
| 2022 | $9,365 | $380,400 | $154,400 | $226,000 |
| 2021 | $7,713 | $339,600 | $154,400 | $185,200 |
| 2020 | $9,360 | $339,600 | $154,400 | $185,200 |
| 2019 | $8,625 | $324,600 | $154,400 | $170,200 |
| 2018 | $9,128 | $324,600 | $154,400 | $170,200 |
| 2017 | $1,692 | $318,400 | $154,400 | $164,000 |
| 2016 | $107,763 | $312,200 | $154,400 | $157,800 |
| 2015 | $6,369 | $14,800 | $4,500 | $10,300 |
| 2014 | $6,369 | $14,800 | $4,500 | $10,300 |
| 2013 | $6,369 | $14,800 | $4,500 | $10,300 |
Source: Public Records
Map
Nearby Homes
- 7 Grandview Ave
- 14 Gates Ave
- 7 Hawkes Ave
- 24 Oakbrook Rd
- 42 Campwoods Grounds
- 200 Route 9a
- 33 Ryder Rd
- 113 Antler Ridge Unit 113
- 126 Whitetail Cir
- 15 Ferris Place
- 40 Minkel Rd
- 7 Bracken Rd
- 47 Stormytown Rd
- 283 Horse Shoe Cir
- 8 Eldridge Ave
- 13 Reeback Dr
- 19 Donald Ln
- 9 Gualtiere Ln
- 11 Knollwood Dr
- 8 Hudson Watch Dr