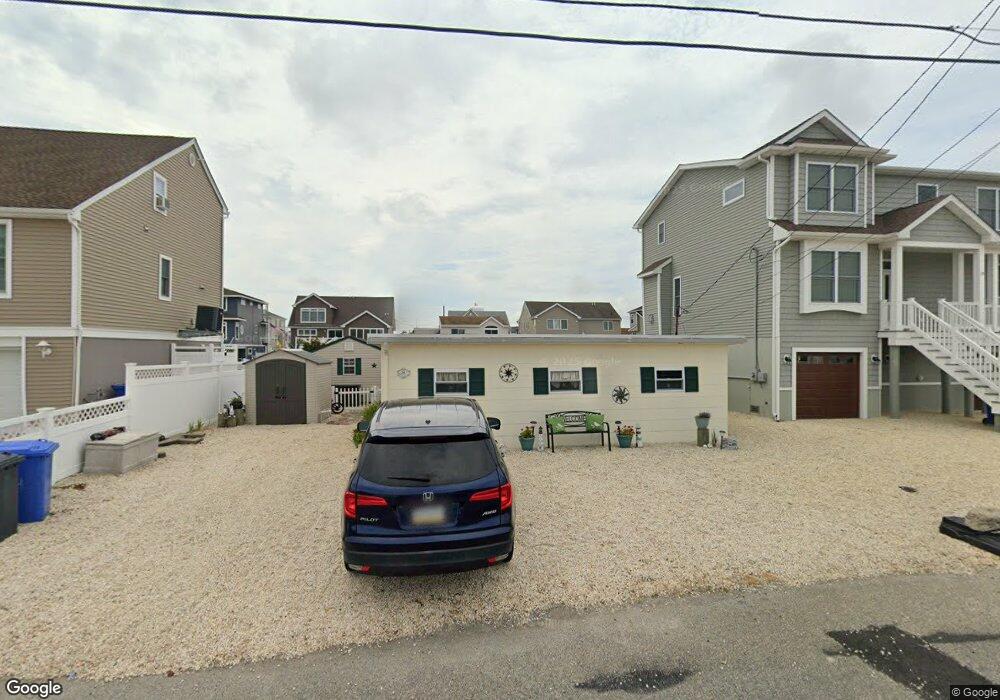
24 Phyllis Ln Manahawkin, NJ 08050
Stafford NeighborhoodEstimated Value: $514,000 - $667,000
3
Beds
1
Bath
856
Sq Ft
$721/Sq Ft
Est. Value
About This Home
This home is located at 24 Phyllis Ln, Manahawkin, NJ 08050 and is currently estimated at $617,141, approximately $720 per square foot. 24 Phyllis Ln is a home located in Ocean County with nearby schools including Oxycocus Elementary School, Ocean Acres Elementary School, and McKinley Avenue Elementary School.
Ownership History
Date
Name
Owned For
Owner Type
Purchase Details
Closed on
Aug 14, 2025
Sold by
Kretzinger Rachel and Rothermel Rachel
Bought by
Rothermel Annette
Current Estimated Value
Purchase Details
Closed on
Feb 7, 2020
Sold by
Rothermel Annette
Bought by
Rothermel Annette and Rothermel Danielle
Purchase Details
Closed on
Oct 21, 2009
Sold by
Rothermel Raymond and Rothermel Annette
Bought by
Rothermel Annette
Purchase Details
Closed on
Jan 13, 2000
Sold by
Hogan William
Bought by
Rothermel Raymond and Rothermel Annette
Home Financials for this Owner
Home Financials are based on the most recent Mortgage that was taken out on this home.
Original Mortgage
$105,000
Interest Rate
7.91%
Create a Home Valuation Report for This Property
The Home Valuation Report is an in-depth analysis detailing your home's value as well as a comparison with similar homes in the area
Home Values in the Area
Average Home Value in this Area
Purchase History
| Date | Buyer | Sale Price | Title Company |
|---|---|---|---|
| Rothermel Annette | -- | University Title | |
| Rothermel Annette | -- | University Title | |
| Rothermel Annette | -- | None Available | |
| Rothermel Annette | -- | None Available | |
| Rothermel Raymond | $97,500 | -- |
Source: Public Records
Mortgage History
| Date | Status | Borrower | Loan Amount |
|---|---|---|---|
| Previous Owner | Rothermel Raymond | $105,000 |
Source: Public Records
Tax History Compared to Growth
Tax History
| Year | Tax Paid | Tax Assessment Tax Assessment Total Assessment is a certain percentage of the fair market value that is determined by local assessors to be the total taxable value of land and additions on the property. | Land | Improvement |
|---|---|---|---|---|
| 2025 | $5,897 | $239,400 | $169,500 | $69,900 |
| 2024 | $5,840 | $237,500 | $169,500 | $68,000 |
| 2023 | $5,591 | $237,500 | $169,500 | $68,000 |
| 2022 | $5,591 | $237,500 | $169,500 | $68,000 |
| 2021 | $5,515 | $237,500 | $169,500 | $68,000 |
| 2020 | $5,522 | $237,500 | $169,500 | $68,000 |
| 2019 | $5,444 | $237,500 | $169,500 | $68,000 |
| 2018 | $5,410 | $237,500 | $169,500 | $68,000 |
| 2017 | $4,800 | $204,000 | $142,700 | $61,300 |
| 2016 | $4,751 | $204,000 | $142,700 | $61,300 |
| 2015 | $4,584 | $204,000 | $142,700 | $61,300 |
| 2014 | $4,561 | $200,500 | $140,500 | $60,000 |
Source: Public Records
Map
Nearby Homes