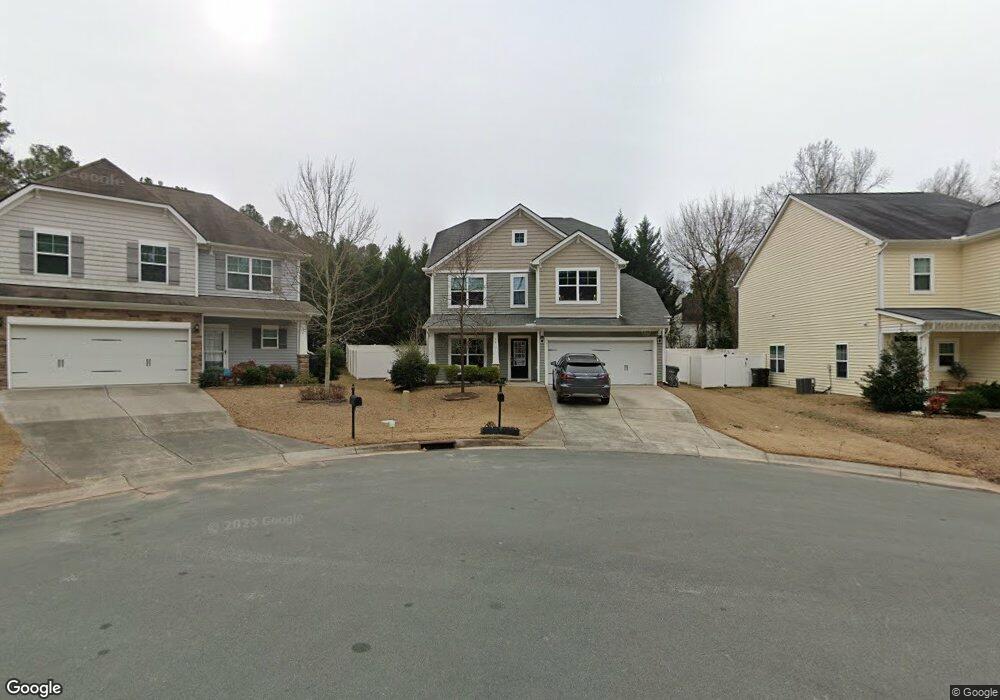
24 Piccadilly Ct Unit 22 Durham, NC 27713
Woodcroft NeighborhoodEstimated Value: $476,460 - $497,000
3
Beds
3
Baths
1,842
Sq Ft
$266/Sq Ft
Est. Value
About This Home
This home is located at 24 Piccadilly Ct Unit 22, Durham, NC 27713 and is currently estimated at $489,115, approximately $265 per square foot. 24 Piccadilly Ct Unit 22 is a home located in Durham County with nearby schools including Southwest Elementary School, Morehead Montessori, and Sherwood Githens Middle.
Ownership History
Date
Name
Owned For
Owner Type
Purchase Details
Closed on
Nov 22, 2016
Sold by
Barclay Edwin R Barclay
Bought by
Barclay Chelsey E
Current Estimated Value
Home Financials for this Owner
Home Financials are based on the most recent Mortgage that was taken out on this home.
Original Mortgage
$199,200
Outstanding Balance
$160,175
Interest Rate
3.47%
Mortgage Type
New Conventional
Estimated Equity
$328,940
Purchase Details
Closed on
Jun 9, 2016
Sold by
Gill Raghubinder S
Bought by
Barclay Edwin R Mali
Purchase Details
Closed on
May 9, 2014
Sold by
Mungo Homes Of North Carolina Inc
Bought by
Gill Raghubinder S and Gill Harjot
Purchase Details
Closed on
Apr 15, 2013
Sold by
Harrington Bank Fsb
Bought by
Mungo Homes Of North Carolina Inc
Create a Home Valuation Report for This Property
The Home Valuation Report is an in-depth analysis detailing your home's value as well as a comparison with similar homes in the area
Home Values in the Area
Average Home Value in this Area
Purchase History
| Date | Buyer | Sale Price | Title Company |
|---|---|---|---|
| Barclay Chelsey E | -- | -- | |
| Barclay Edwin R Mali | $249,000 | -- | |
| Gill Raghubinder S | $213,500 | None Available | |
| Mungo Homes Of North Carolina Inc | $174,000 | None Available |
Source: Public Records
Mortgage History
| Date | Status | Borrower | Loan Amount |
|---|---|---|---|
| Open | Barclay Chelsey E | $199,200 |
Source: Public Records
Tax History Compared to Growth
Tax History
| Year | Tax Paid | Tax Assessment Tax Assessment Total Assessment is a certain percentage of the fair market value that is determined by local assessors to be the total taxable value of land and additions on the property. | Land | Improvement |
|---|---|---|---|---|
| 2025 | $3,873 | $482,011 | $112,000 | $370,011 |
| 2024 | $3,873 | $277,656 | $50,580 | $227,076 |
| 2023 | $3,637 | $277,656 | $50,580 | $227,076 |
| 2022 | $3,554 | $277,656 | $50,580 | $227,076 |
| 2021 | $3,537 | $277,656 | $50,580 | $227,076 |
| 2020 | $3,454 | $277,656 | $50,580 | $227,076 |
| 2019 | $3,454 | $277,656 | $50,580 | $227,076 |
| 2018 | $3,007 | $221,697 | $42,150 | $179,547 |
| 2017 | $2,985 | $221,697 | $42,150 | $179,547 |
| 2016 | $2,885 | $221,697 | $42,150 | $179,547 |
| 2015 | $1,718 | $124,083 | $43,067 | $81,016 |
| 2014 | $1,045 | $75,474 | $43,067 | $32,407 |
Source: Public Records
Map
Nearby Homes
- 33 Juliette Dr
- 118 Fallenwood Ave
- 6 Tinsbury Place
- 8 Kilbreth Ave
- 12 Cobble Glen Ct
- 309 Ebon Rd
- 5340 Fayetteville Rd
- 227 Obie Dr
- 311 Ebon Rd
- 7 Hitching Rack Ct
- 311 Denton St
- 5034 Mimosa Dr
- 5006 Silhouette Dr
- 5015 Silhouette Dr
- 611 Ashford Ln
- 601 Panama Terrace
- 611 Panama Terrace
- 22 Cottage Woods Ct
- 812 Beebe Dr
- 5429 Fortunes Ridge Dr
- 24 Piccadilly Ct
- 22 Piccadilly Ct Unit 23
- 22 Piccadilly Ct
- 2212 Gablefield Ln
- 26 Piccadilly Ct Unit 21
- 26 Piccadilly Ct
- 20 Piccadilly Ct
- 28 Piccadilly Ct Unit 20
- 28 Piccadilly Ct
- 2216 Gablefield Ln
- 27 Piccadilly Ct Unit 19
- 27 Piccadilly Ct
- 2215 Gablefield Ln
- 2217 Gablefield Ln
- 25 Piccadilly Ct Unit 18
- 25 Piccadilly Ct
- 21 Piccadilly Ct Unit 16
- 21 Piccadilly Ct
- 2219 Gablefield Ln
- 100 Wood Valley Ct